Free Access
Fig. 18.
Download original image
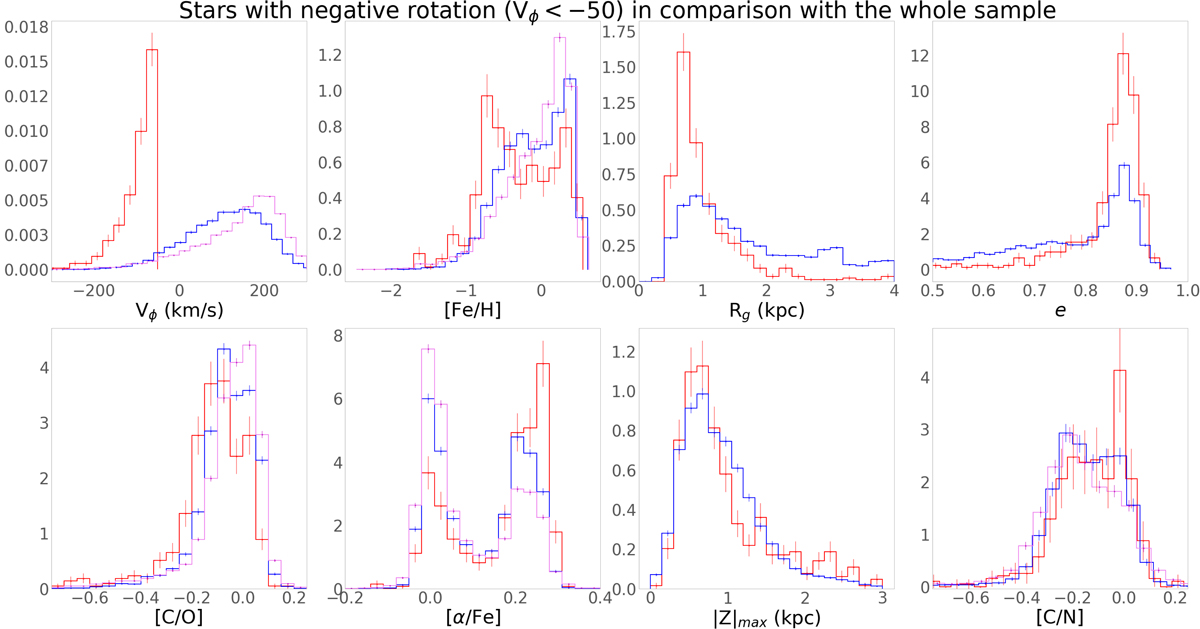
Distribution of all stars with Vϕ < −50 km s−1 in the RPM sample shown in red as a function of many parameters, and compared to the same distribution for all stars in the RPM sample shown in dark blue, and all stars in the bulge–bar sample indicated by the violet lines.
Current usage metrics show cumulative count of Article Views (full-text article views including HTML views, PDF and ePub downloads, according to the available data) and Abstracts Views on Vision4Press platform.
Data correspond to usage on the plateform after 2015. The current usage metrics is available 48-96 hours after online publication and is updated daily on week days.
Initial download of the metrics may take a while.