Free Access
Fig. 10.
Download original image
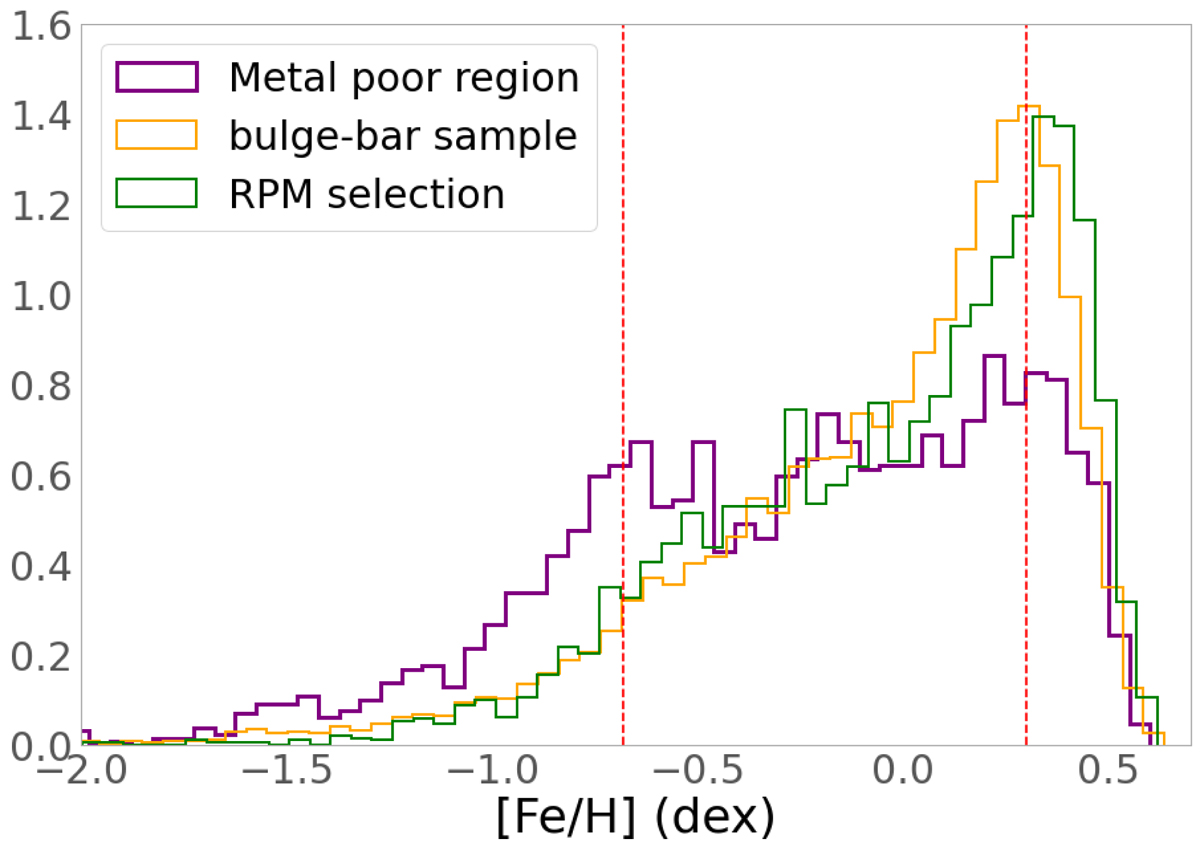
MDF for the bulge–bar field, RPM sample, and metal-poor region highlighted in Fig. 7. The prominent peaks of the distributions are indicated by the vertical dashed lines.
Current usage metrics show cumulative count of Article Views (full-text article views including HTML views, PDF and ePub downloads, according to the available data) and Abstracts Views on Vision4Press platform.
Data correspond to usage on the plateform after 2015. The current usage metrics is available 48-96 hours after online publication and is updated daily on week days.
Initial download of the metrics may take a while.