Fig. 9.
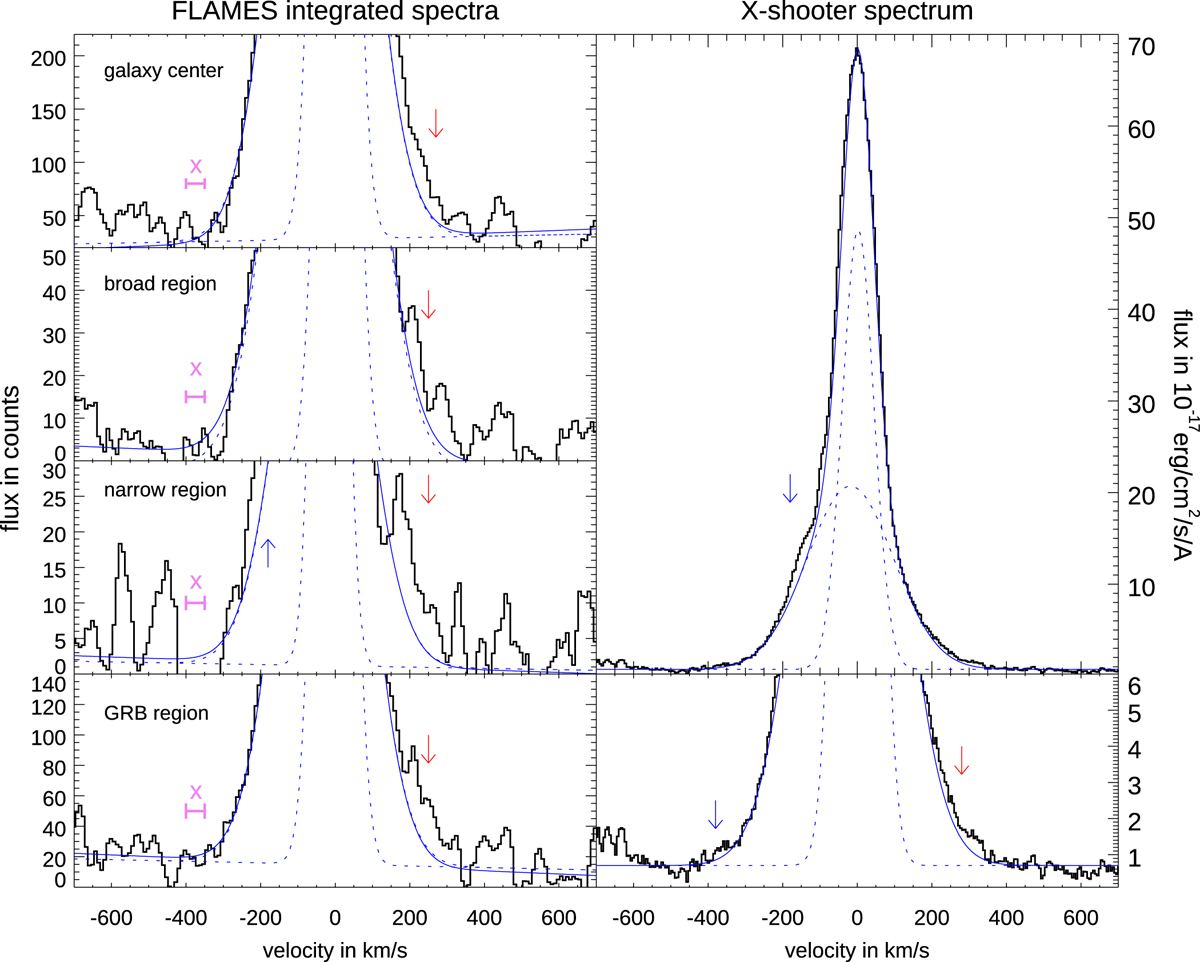
Download original image
GRB 031203: Zoom into Hα to look for the high velocity excess emission in both red and blue wings claimed to be detected in the X-shooter spectra by Guseva et al. (2011). Left: integrated regions in the FLAMES spectra explained in Fig. 7. Right: X-shooter spectrum. The scale for all panels (except the full size X-shooter panel) is ∼0.1 of the Hα peak value. Excess emission components that we detect in both spectra are marked with arrows indicating with the same colors the same components detected in different spectra. The region where excess emission has been found in the blue wing of the X-shooter spectra but not in the FLAMES spectra is marked with a purple bar and cross. Zero velocity has been chosen as the centroid of the narrow emission component.
Current usage metrics show cumulative count of Article Views (full-text article views including HTML views, PDF and ePub downloads, according to the available data) and Abstracts Views on Vision4Press platform.
Data correspond to usage on the plateform after 2015. The current usage metrics is available 48-96 hours after online publication and is updated daily on week days.
Initial download of the metrics may take a while.