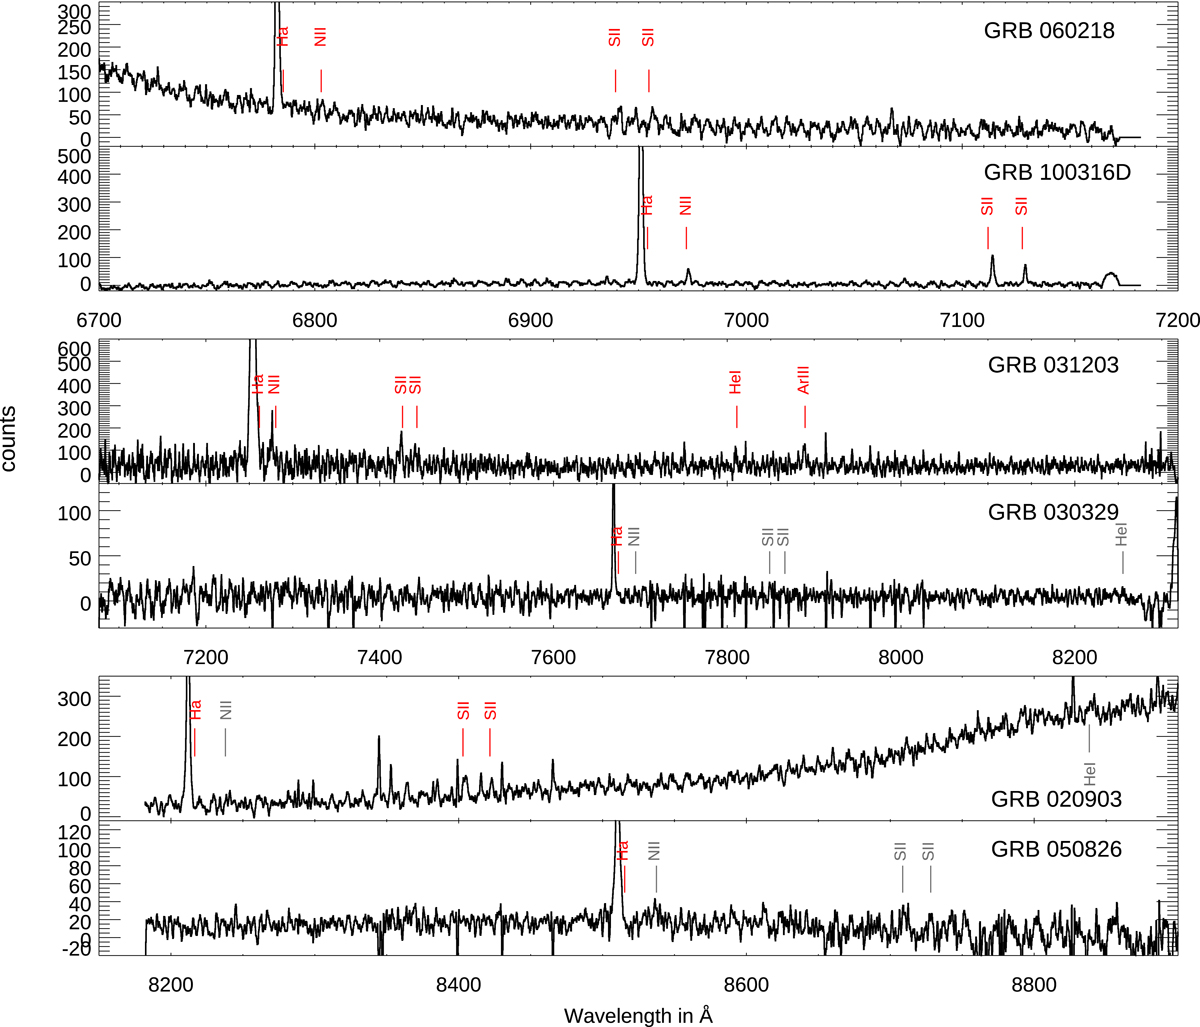
Fig. 2.
Download original image
Integrated spectra of the 6 galaxies in our sample, grouped by the different grating settings used (top to bottom: LR 6, 7 and 8). Red lines are detected transitions, gray tick marks indicate the position of emission lines that are not detected in that particular host. For each spectrum we summed the flux for all regions where Hα is detected and subtracted the average sky background using at least 9 spaxels outside the host galaxy. The final spectra have been smoothed with a Gaussian kernel of 5.
Current usage metrics show cumulative count of Article Views (full-text article views including HTML views, PDF and ePub downloads, according to the available data) and Abstracts Views on Vision4Press platform.
Data correspond to usage on the plateform after 2015. The current usage metrics is available 48-96 hours after online publication and is updated daily on week days.
Initial download of the metrics may take a while.