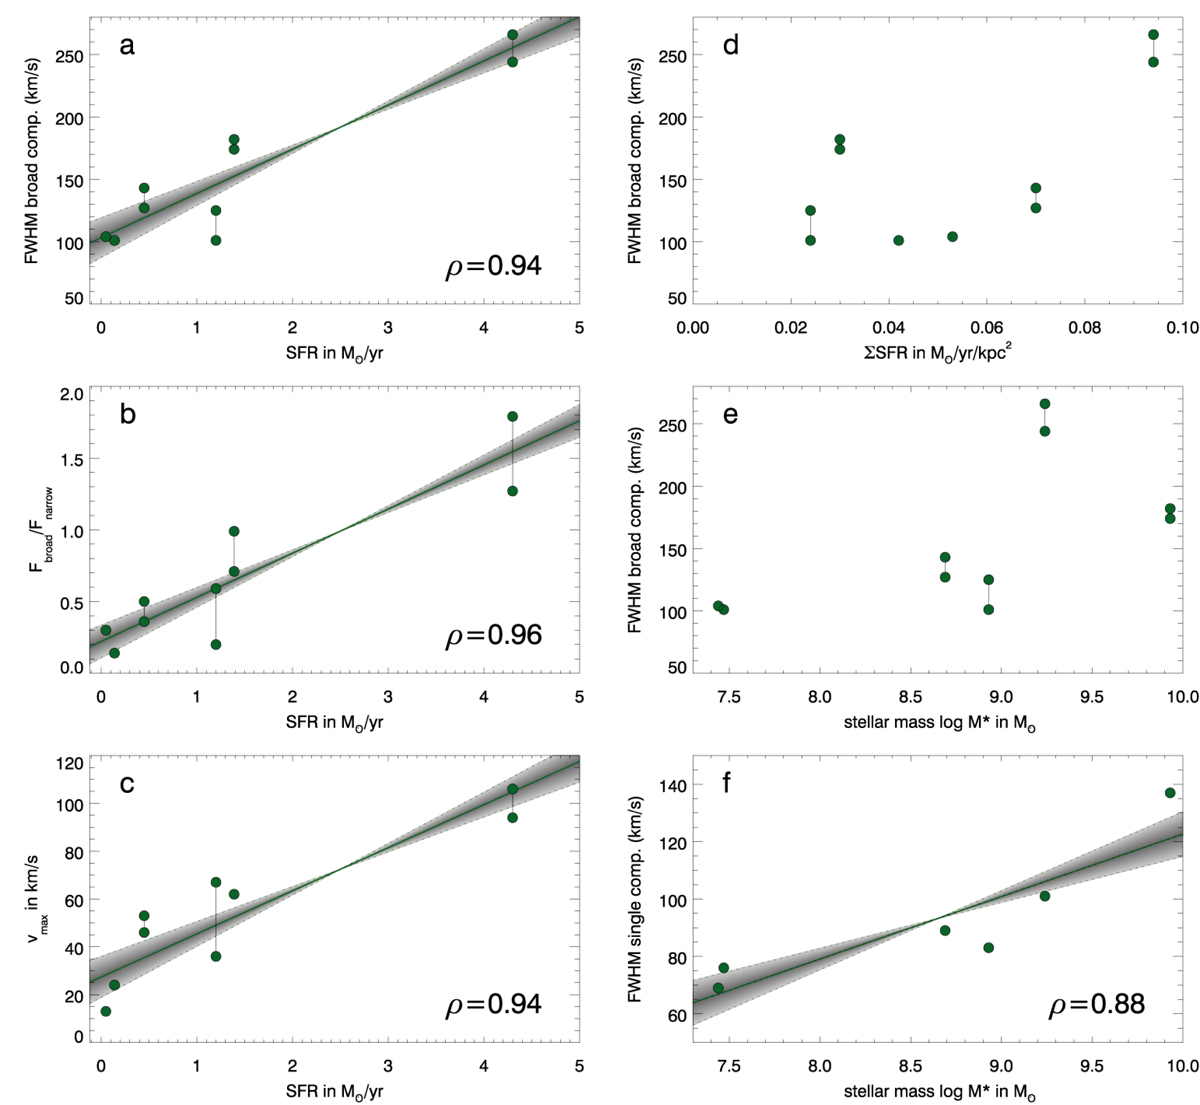
Fig. 16.
Download original image
Panels A–C: correlations between SFR and FWHM of the broad emission component, Fbroad/Fnarrow and Vmax (see Sect. 4.4). For hosts with a range of values we plot the upper and lower limits. In panels with linear correlations, green lines are the linear fit, the shaded area is the error of the slope. In case of a range of values for the y-axis we take the average to fit the correlation. Panels D and E: FWHM of the broad component vs. SFR density and M* for which there are no clear correlations. Panel F: a weak correlation is also found for M* and the width of a single Gaussian fit to the integrated galaxy spectra (σint in Table 2, here plotted as FWHM for consistency with the other plots), which corresponds to a stellar mass Tully Fisher relation. ρ indicates the Pearson’s coefficient for the different correlations.
Current usage metrics show cumulative count of Article Views (full-text article views including HTML views, PDF and ePub downloads, according to the available data) and Abstracts Views on Vision4Press platform.
Data correspond to usage on the plateform after 2015. The current usage metrics is available 48-96 hours after online publication and is updated daily on week days.
Initial download of the metrics may take a while.