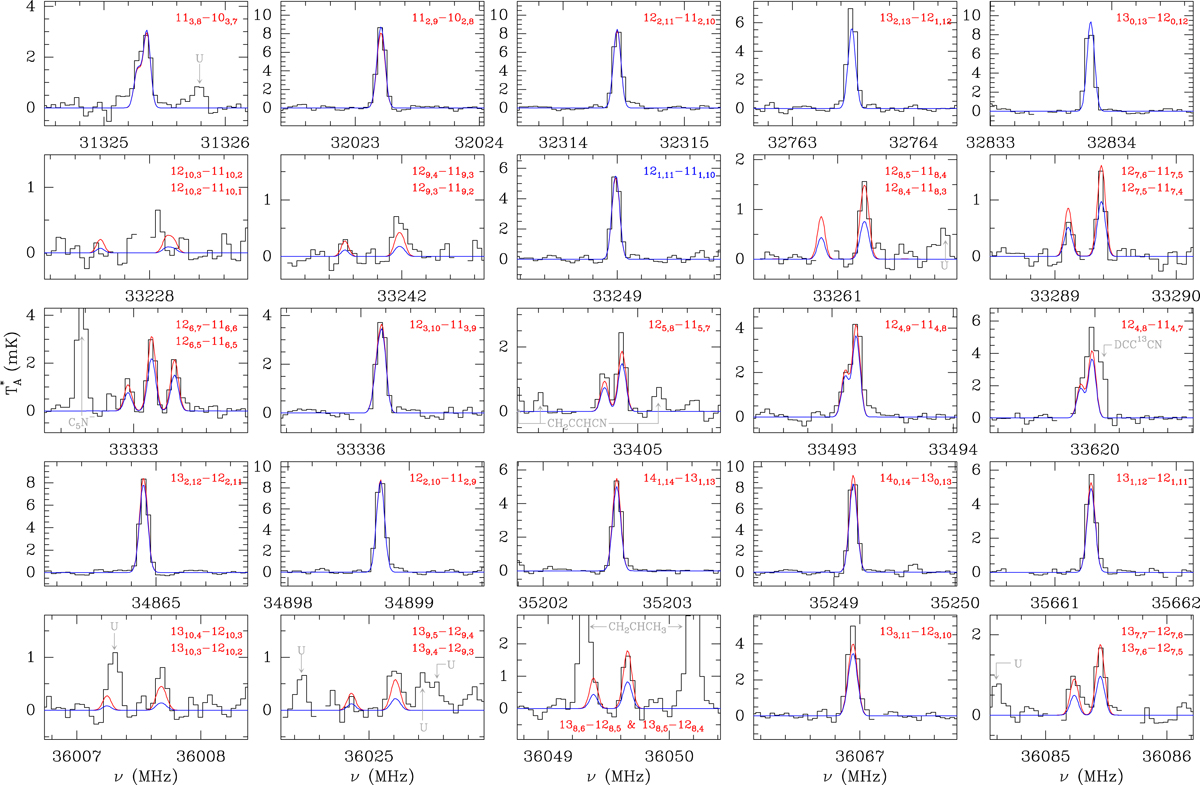
Fig. C.1.
Download original image
Observed lines of C6H5CN in the 31-50 GHz frequency range towards TMC-1. The abscissa corresponds to the rest frequency assuming a local standard of rest velocity of 5.83 km s−1. The ordinate is the antenna temperature corrected for atmospheric and telescope losses in mK. The red line shows the synthetic spectrum obtained from a fit to the observed line profiles, which provides Tr = 9 ± 0.5 K and N(C6H5CN) = (1.2 ± 0.1) × 1012 cm−2. The blue line shows the synthetic spectrum for a rotational temperature of 6 K and a column density of 1.5 × 1012 cm−2. The rotational quantum numbers are indicated in each panel. Blanked channels correspond to negative features produced in the folding of the frequency switching data. While the blue line produces a very good agreement with the observed intensities for Ka≤4, for higher values of Ka it underestimates the observed intensities by a factor of two.
Current usage metrics show cumulative count of Article Views (full-text article views including HTML views, PDF and ePub downloads, according to the available data) and Abstracts Views on Vision4Press platform.
Data correspond to usage on the plateform after 2015. The current usage metrics is available 48-96 hours after online publication and is updated daily on week days.
Initial download of the metrics may take a while.