Open Access
Fig. 2

Download original image
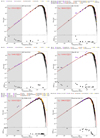
SED data for every star shown with legends providing VizieR catalogue references. The red meshed region shows a blackbody model with Teff values from Soubiran et al. (2016), specified in each panel. The black curve shows the PHOENIX SED model.
This figure is made of several images, please see below:
Current usage metrics show cumulative count of Article Views (full-text article views including HTML views, PDF and ePub downloads, according to the available data) and Abstracts Views on Vision4Press platform.
Data correspond to usage on the plateform after 2015. The current usage metrics is available 48-96 hours after online publication and is updated daily on week days.
Initial download of the metrics may take a while.