Fig. 5
Download original image
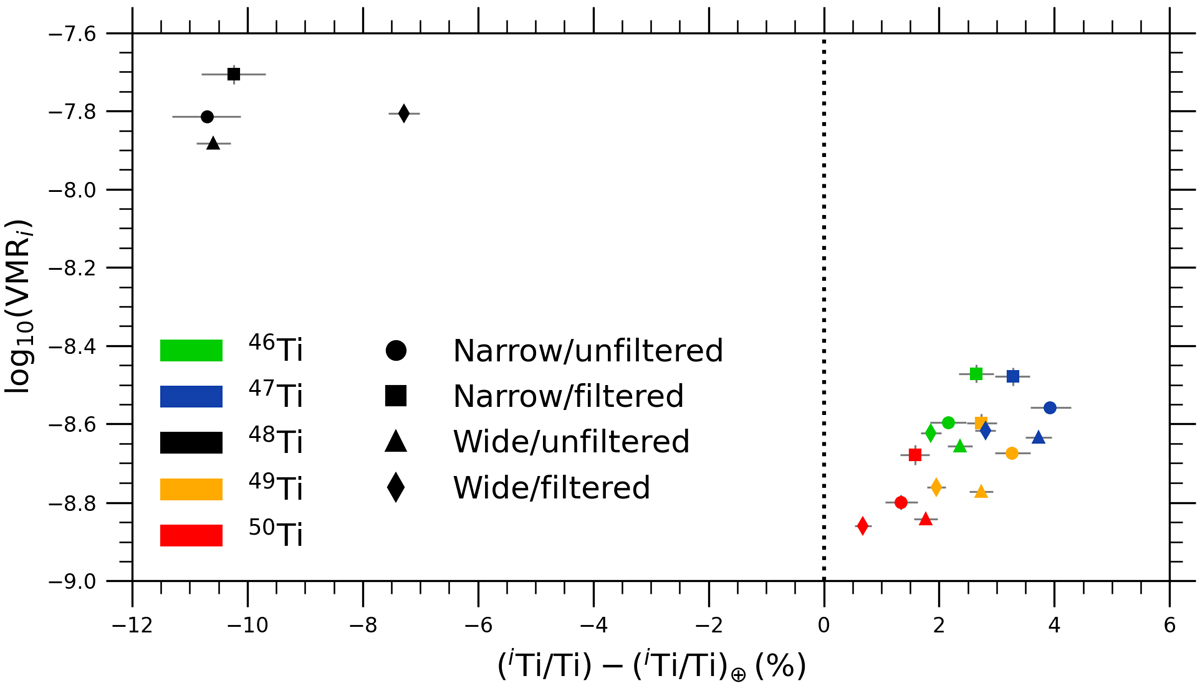
Comparison of absolute and relative abundances derived from each retrieval methodology, demonstrating the small impact the wavelength range and broadband filtering have on the results. For each stable titanium isotope
iTi, the retrieved![]() of the corresponding isotopologue iTiO is shown on the y-axis, while the x-axis shows the absolute deviation in the relative abundance iTi/Ti compared tothe terrestrial value (vertical dotted line). The markers colored green, blue, black, orange, and red are used for 46Ti, 47Ti, 48Ti, 49Ti, and 50Ti, respectively. The results for the narrow and unfiltered, narrow and filtered, wide and unfiltered, and wide and filtered spectra are denoted by the circular, square, triangular, and diamond markers, respectively. The 1σ errors, derived from the MCMC posteriors, are shown in gray.
of the corresponding isotopologue iTiO is shown on the y-axis, while the x-axis shows the absolute deviation in the relative abundance iTi/Ti compared tothe terrestrial value (vertical dotted line). The markers colored green, blue, black, orange, and red are used for 46Ti, 47Ti, 48Ti, 49Ti, and 50Ti, respectively. The results for the narrow and unfiltered, narrow and filtered, wide and unfiltered, and wide and filtered spectra are denoted by the circular, square, triangular, and diamond markers, respectively. The 1σ errors, derived from the MCMC posteriors, are shown in gray.
Current usage metrics show cumulative count of Article Views (full-text article views including HTML views, PDF and ePub downloads, according to the available data) and Abstracts Views on Vision4Press platform.
Data correspond to usage on the plateform after 2015. The current usage metrics is available 48-96 hours after online publication and is updated daily on week days.
Initial download of the metrics may take a while.