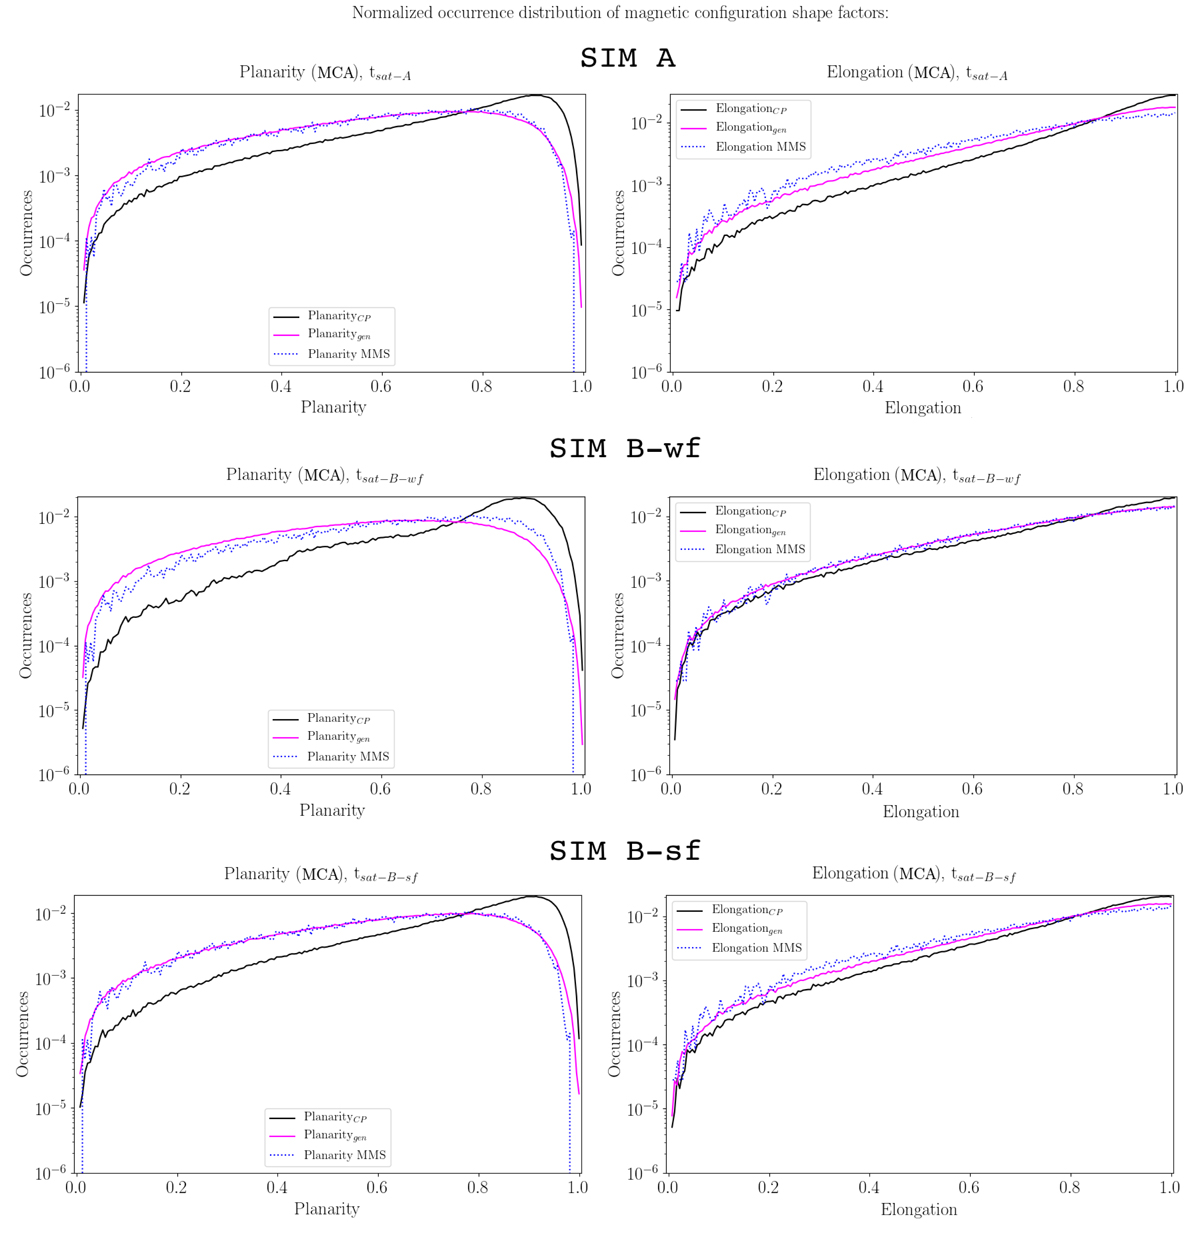
Fig. 7.
Download original image
Normalized occurrence distributions of 𝒫 and ℰ for the three simulations SIM A, SIM B-wf, and SIM B-sf, distinguishing between statistics on generic points (magenta line) and points which belong to current structures (black line). We superpose these distributions, obtained from simulations, to the ones obtained using satellite data (dotted blue line) from the two high-resolution magnetosheath intervals analyzed in Stawarz et al. (2019), see Appendix B for details.
Current usage metrics show cumulative count of Article Views (full-text article views including HTML views, PDF and ePub downloads, according to the available data) and Abstracts Views on Vision4Press platform.
Data correspond to usage on the plateform after 2015. The current usage metrics is available 48-96 hours after online publication and is updated daily on week days.
Initial download of the metrics may take a while.