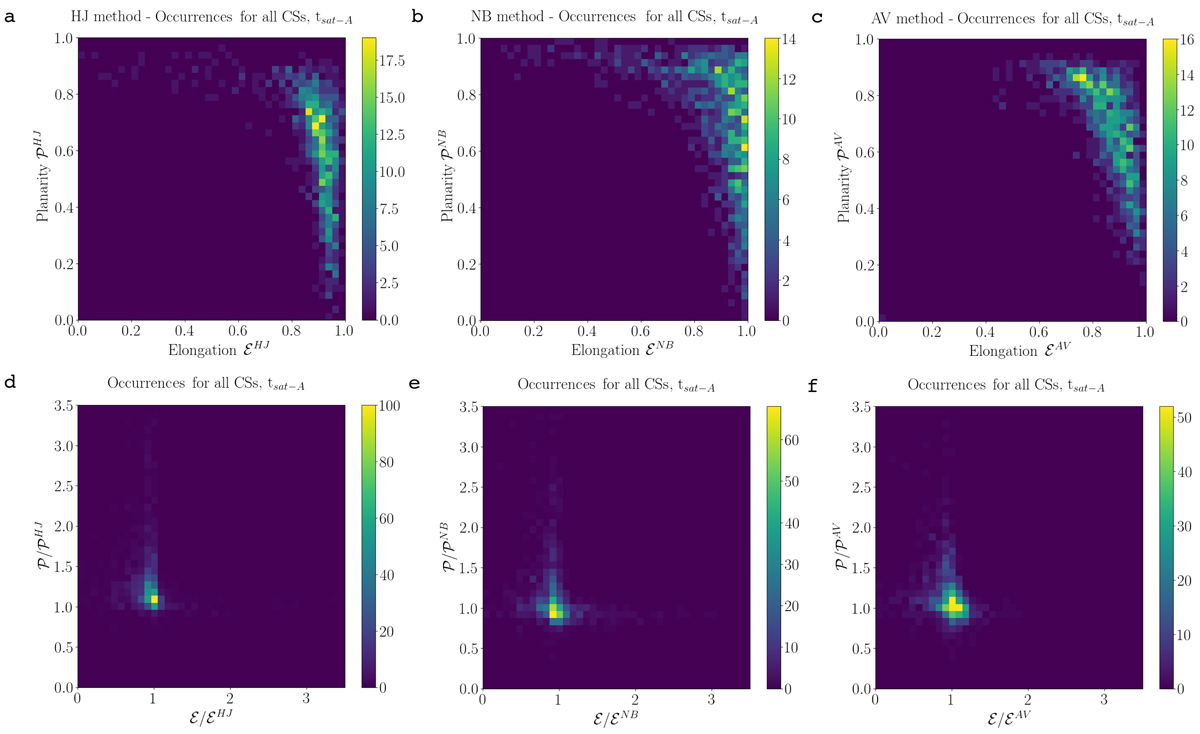
Fig. 5.
Download original image
Occurrence distributions of elongation versus planarity, for SIM A. Top row panels: (a) HJ method, (b) NB method, and (c) AV method. Bottom row panels: (d) ℰ/ℰHJ versus 𝒫/𝒫HJ, (e) ℰ/ℰNB versus 𝒫/𝒫NB, and (f) ℰ/ℰAV versus 𝒫/𝒫AV, thus the comparison between our local methods and our overall nonlocal reference values ℰ and 𝒫. The x and y ranges in panels d–f have been adapted in order to produce a better visualization. In doing so, some cases have been excluded including the following: 21 out of the total 1043 current structures (CSs) examined in panel d, 23 out of 1043 in panel e, and two out of 1043 in panel f.
Current usage metrics show cumulative count of Article Views (full-text article views including HTML views, PDF and ePub downloads, according to the available data) and Abstracts Views on Vision4Press platform.
Data correspond to usage on the plateform after 2015. The current usage metrics is available 48-96 hours after online publication and is updated daily on week days.
Initial download of the metrics may take a while.