Fig. 3
Download original image
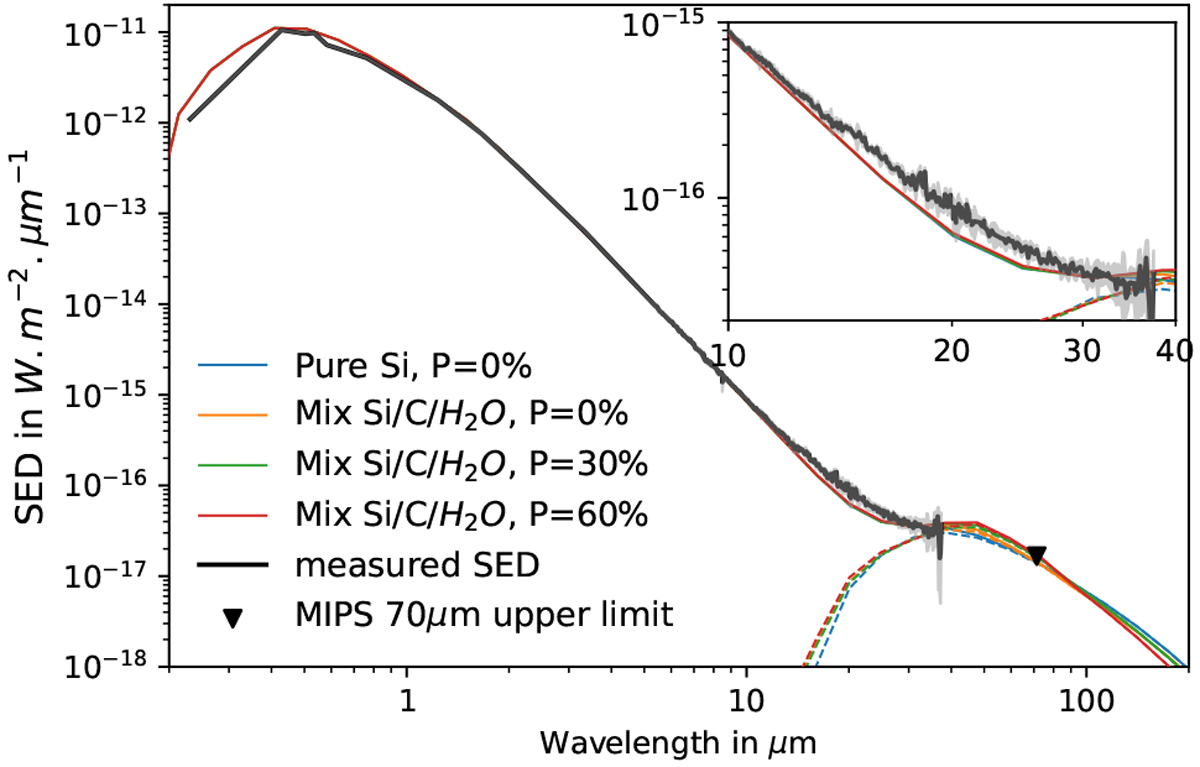
Spectral energy distribution of HD 141011 and the infrared measurements from Spitzer (black line, gray shading for the uncertainty, and triangle for the upper limit). We overplot in colors the four SED models that are compatible with the mid-infrared excess, all with a minimum particle size of 1 μm. The plain lines represent the stellar photosphere and disk emission, while the dashed lines isolate the contribution of the disk alone. The inset is a zoom in the 10–40 μm range, highlighting the model mismatch between 15 and 25 μm.
Current usage metrics show cumulative count of Article Views (full-text article views including HTML views, PDF and ePub downloads, according to the available data) and Abstracts Views on Vision4Press platform.
Data correspond to usage on the plateform after 2015. The current usage metrics is available 48-96 hours after online publication and is updated daily on week days.
Initial download of the metrics may take a while.