Open Access
Fig. 2
Download original image
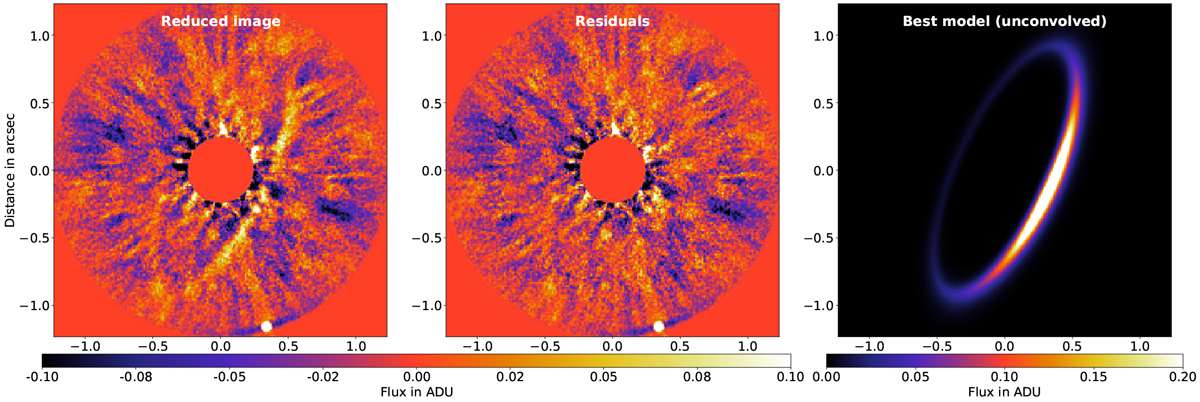
Left: IRDIS-reduced image used as a starting point for the forward-modeling, and obtained by averaging the PCA reductions from the 2016 and 2019 epochs. Middle: residuals after subtraction and forward-modeling of the best model. Right: best unconvolved model. North is up and east to the left.
Current usage metrics show cumulative count of Article Views (full-text article views including HTML views, PDF and ePub downloads, according to the available data) and Abstracts Views on Vision4Press platform.
Data correspond to usage on the plateform after 2015. The current usage metrics is available 48-96 hours after online publication and is updated daily on week days.
Initial download of the metrics may take a while.