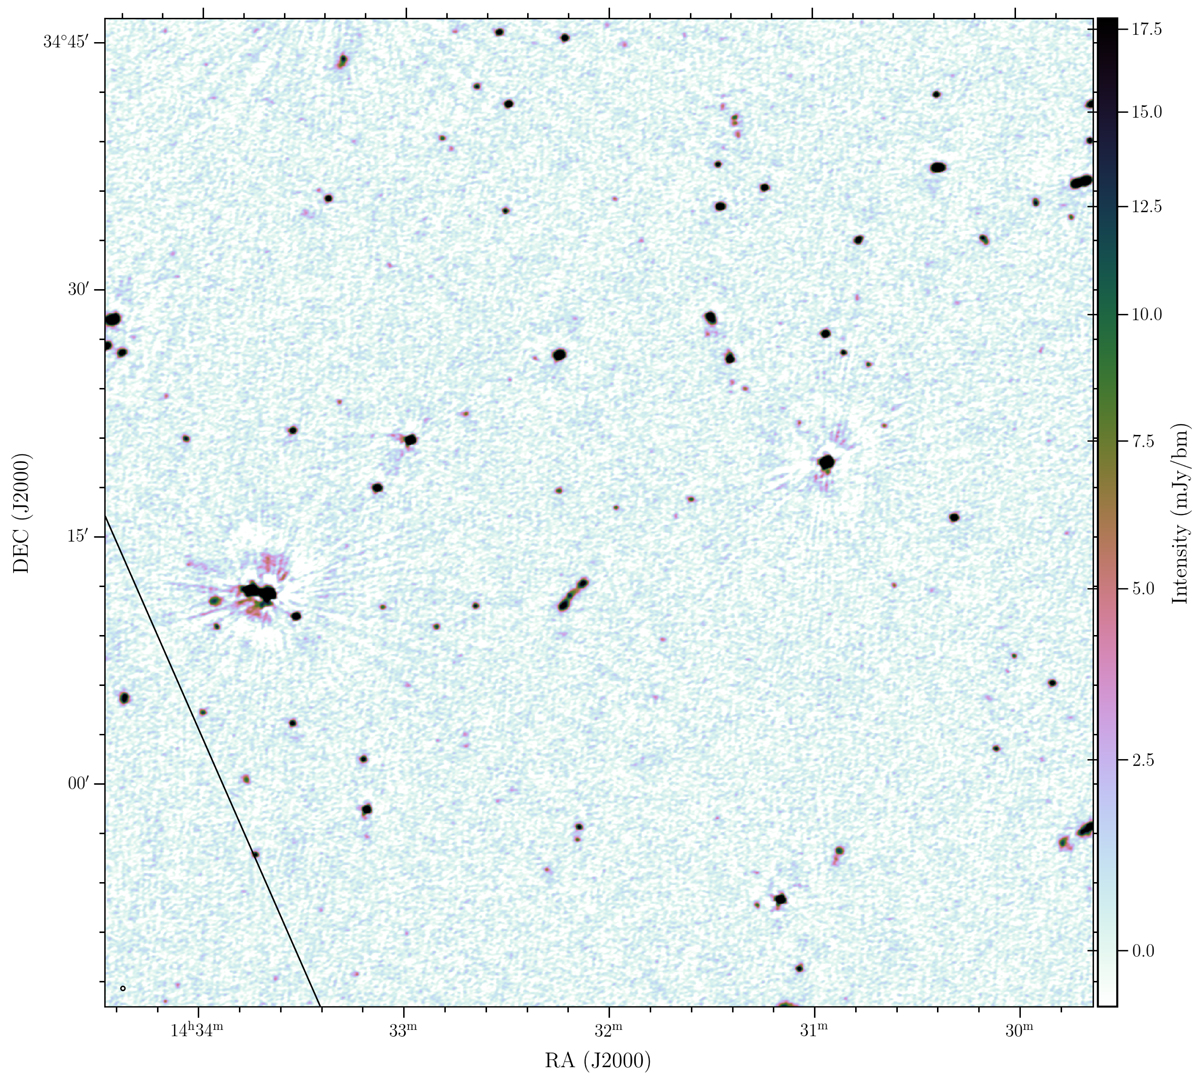
Fig. 5.
Download original image
Zoom-in of the central part of the primary-beam-corrected image. The image covers 1 deg2. The colour scale shows the flux density from −3σcen to 25σcen where σcen = 0.7 mJy beam−1 is the approximate rms in the image centre. The black line shows one of the facet boundaries used in the calibration and imaging – even sources on or near the facet boundaries are well imaged.
Current usage metrics show cumulative count of Article Views (full-text article views including HTML views, PDF and ePub downloads, according to the available data) and Abstracts Views on Vision4Press platform.
Data correspond to usage on the plateform after 2015. The current usage metrics is available 48-96 hours after online publication and is updated daily on week days.
Initial download of the metrics may take a while.