Fig. 13.
Download original image
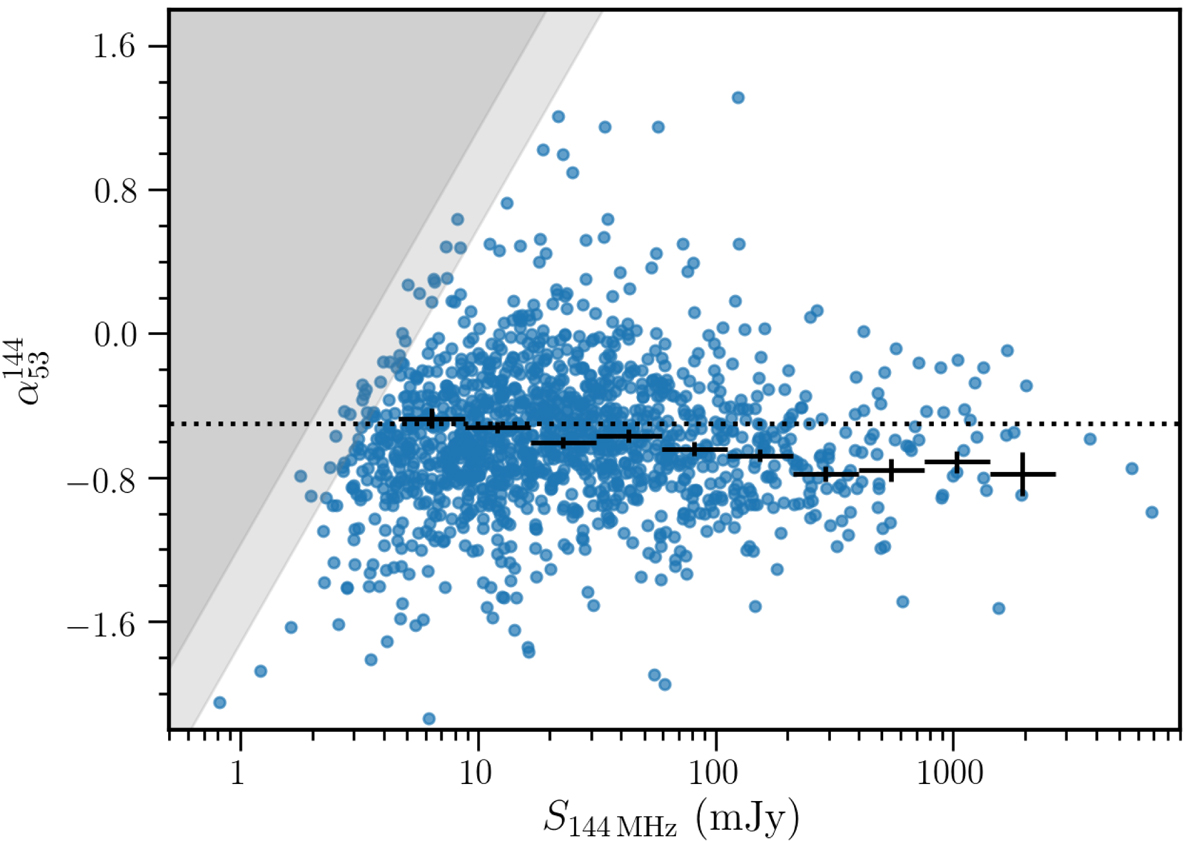
Spectral indices measured between 54 and 144 MHz with LOFAR LBA and HBA respectively. The grey shaded areas show where the distribution becomes incomplete for flatter sources due to the varying sensitivity of the LBA observations, assuming a 5σ detection of a point source at the minimum (0.65 mJy beam−1, light grey) and median (1.1 mJy beam−1, dark grey) rms. The dotted line shows a value of −0.5 to guide the eye. The black points show the median values and errors on the median within equally spaced logarithmic flux-density bins, showing a flattening of spectra towards lower flux densities.
Current usage metrics show cumulative count of Article Views (full-text article views including HTML views, PDF and ePub downloads, according to the available data) and Abstracts Views on Vision4Press platform.
Data correspond to usage on the plateform after 2015. The current usage metrics is available 48-96 hours after online publication and is updated daily on week days.
Initial download of the metrics may take a while.