Fig. 10.
Download original image
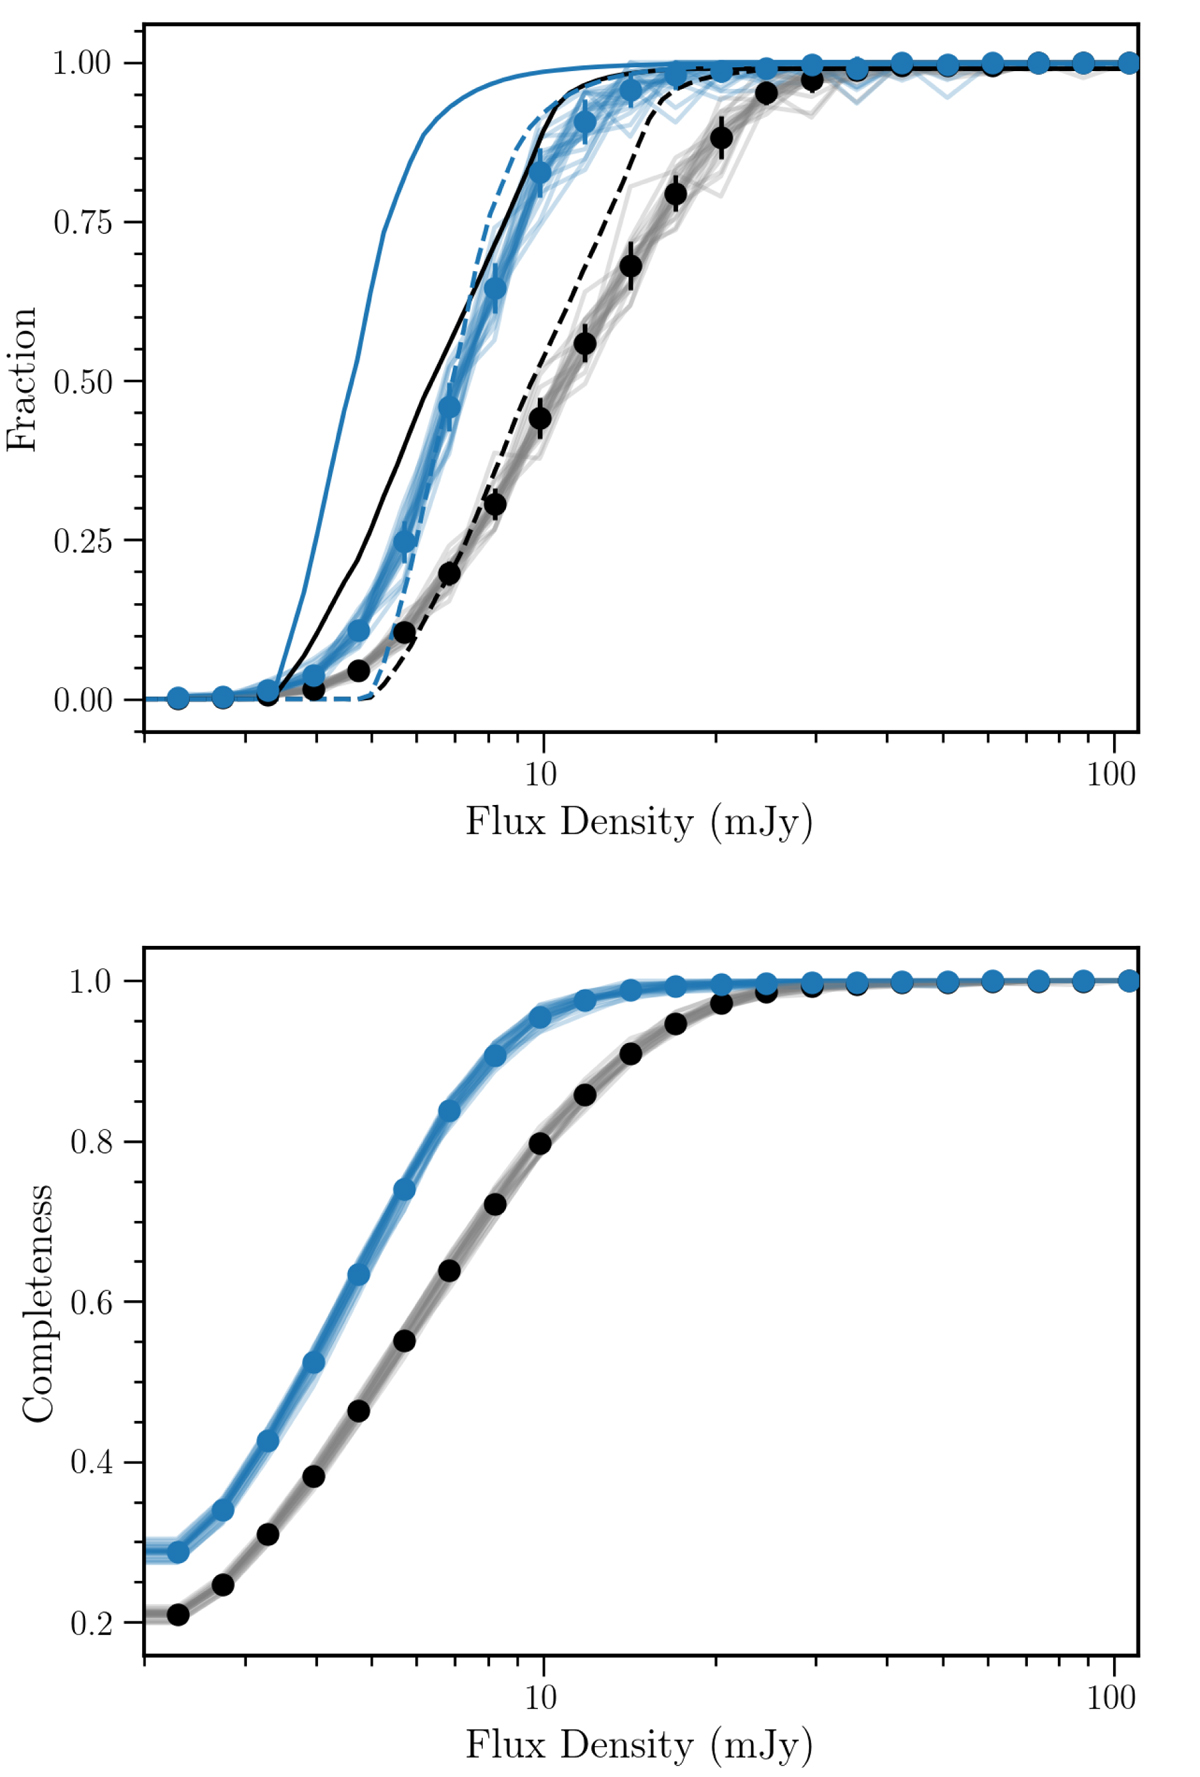
Top: fraction of simulated sources detected as a function of flux density for each simulated image (in grey) and the median binned points (in black). The solid black line shows the fraction of sources that could be detected with a 5σ peak intensity threshold based on the rms only, while the dashed black line shows the same but assuming a single average smearing factor of 1.5, most applicable for the center of the field. The blue points and lines show the same, but determined only over the area with deep optical coverage. Bottom: Estimated completeness above a given flux density –assuming the 150-MHz source count distribution of Mandal et al. (2021)– scaled to 54 MHz assuming an average spectral index of −0.8. This is estimated for the full field (shown in grey and black), and for the region of deep optical coverage (shown in light and solid blue).
Current usage metrics show cumulative count of Article Views (full-text article views including HTML views, PDF and ePub downloads, according to the available data) and Abstracts Views on Vision4Press platform.
Data correspond to usage on the plateform after 2015. The current usage metrics is available 48-96 hours after online publication and is updated daily on week days.
Initial download of the metrics may take a while.