Fig. 9.
Download original image
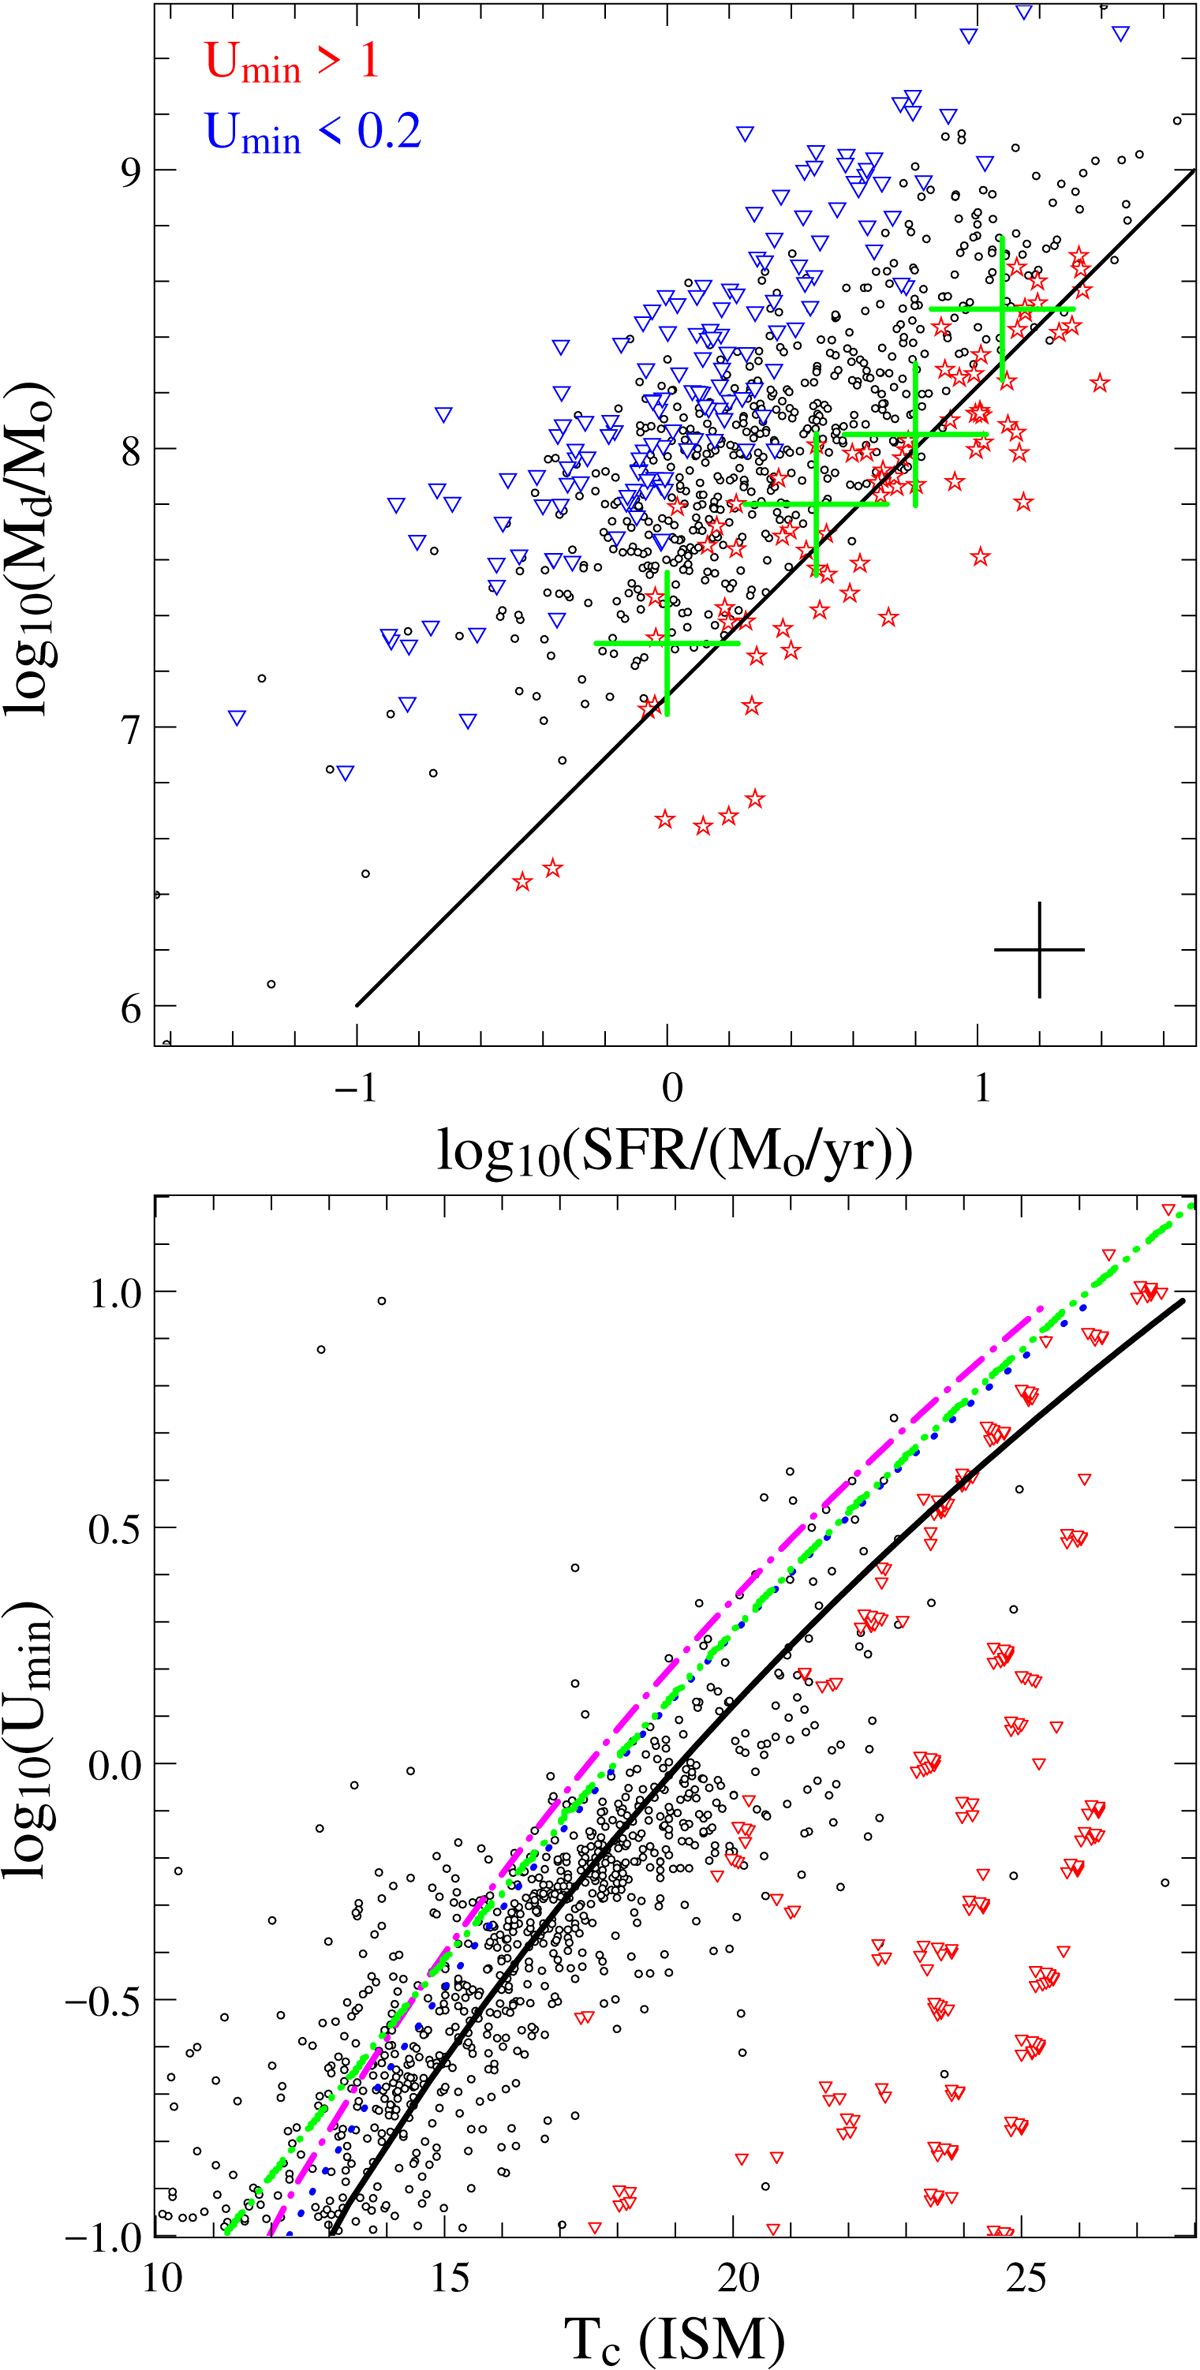
Top panel: dust mass (Md) as a function of the SFR obtained with CIGALE (Noll et al. 2009) using the full photometric coverage. Red stars and blue triangles identify galaxies with Umin > 1.0 and Umin < 0.2, respectively, and the black cross in the bottom right corner shows the average errors in the fit. The solid line and the green crosses show the results from da Cunha et al. (2010) and Smith et al. (2012), respectively. Bottom panel: black circles show the Umin obtained with CIGALE as a function of the temperature of the cold dust in thermal equilibrium within the ISM (![]() ) obtained with MAGPHYS using the full photometric coverage. Red triangles show the results obtained with Draine & Li (2007) models in Hunt et al. (2015) for KINGFISH. Magenta dot-dashed, green double dot-dashed, and blue dotted lines show the best fit obtained by Boulanger et al. (1996) for the solar neighborhood with Td =
) obtained with MAGPHYS using the full photometric coverage. Red triangles show the results obtained with Draine & Li (2007) models in Hunt et al. (2015) for KINGFISH. Magenta dot-dashed, green double dot-dashed, and blue dotted lines show the best fit obtained by Boulanger et al. (1996) for the solar neighborhood with Td = ![]() (A = 17.5 K and β = 2), the best fit obtained with Draine & Li (2007) models in KINGFISH (Hunt et al. 2015), and the relation of Draine & Li (2007) with A = 18 K and β = 2 (see also Eq. (13) in Draine et al. 2014), respectively. The black solid line shows the best fit for our sample obtained for A = 19.1 K and β = 2.
(A = 17.5 K and β = 2), the best fit obtained with Draine & Li (2007) models in KINGFISH (Hunt et al. 2015), and the relation of Draine & Li (2007) with A = 18 K and β = 2 (see also Eq. (13) in Draine et al. 2014), respectively. The black solid line shows the best fit for our sample obtained for A = 19.1 K and β = 2.
Current usage metrics show cumulative count of Article Views (full-text article views including HTML views, PDF and ePub downloads, according to the available data) and Abstracts Views on Vision4Press platform.
Data correspond to usage on the plateform after 2015. The current usage metrics is available 48-96 hours after online publication and is updated daily on week days.
Initial download of the metrics may take a while.