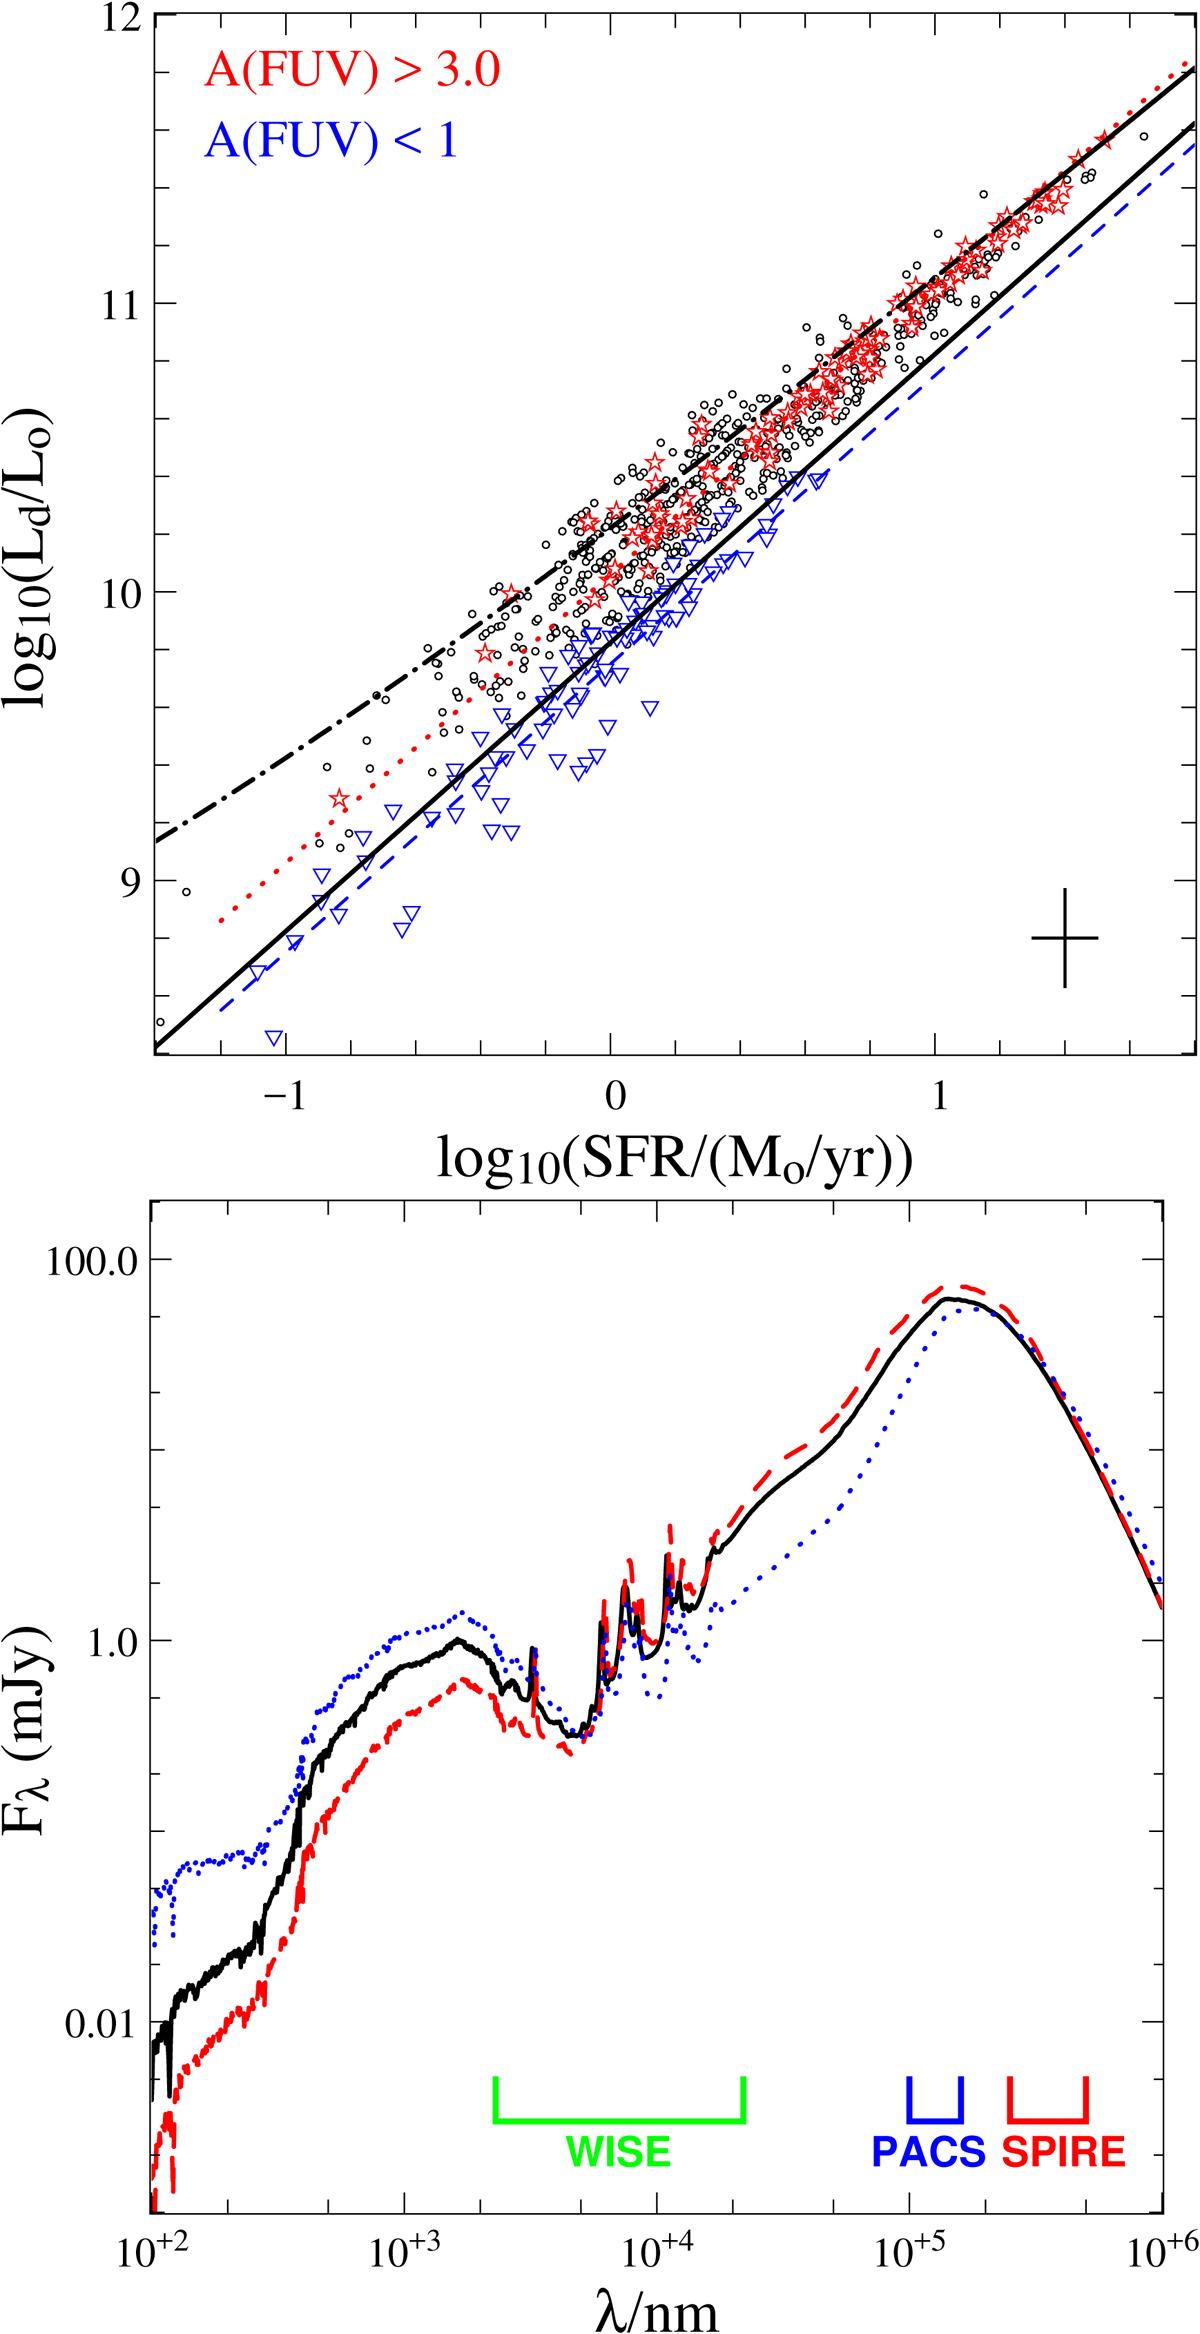
Fig. 8.
Download original image
Top panel: dust luminosity (Ld) as a function of the SFR obtained with CIGALE (Noll et al. 2009) using the full photometric coverage. Red stars and blue triangles identify galaxies with A(FUV) > 3.0 and A(FUV) < 1, with their best fit shown as red dotted and blue dashed lines, respectively. Red dotted and blue dashed lines show the best fit for the galaxies showing high and low levels of extinction, respectively. The solid and dot-dashed black lines show the SFR as derived from Eqs. (1) (Kennicutt 1998) and (2) (Clemens et al. 2013), respectively. Bottom panel: median SED obtained using the full photometric coverage (black solid line), considering the galaxies with A(FUV) > 3.0 (red dashed line) and A(FUV) < 1 (blue dotted line). The photometric coverage of WISE, PACS, and SPIRE bands is shown at the bottom.
Current usage metrics show cumulative count of Article Views (full-text article views including HTML views, PDF and ePub downloads, according to the available data) and Abstracts Views on Vision4Press platform.
Data correspond to usage on the plateform after 2015. The current usage metrics is available 48-96 hours after online publication and is updated daily on week days.
Initial download of the metrics may take a while.