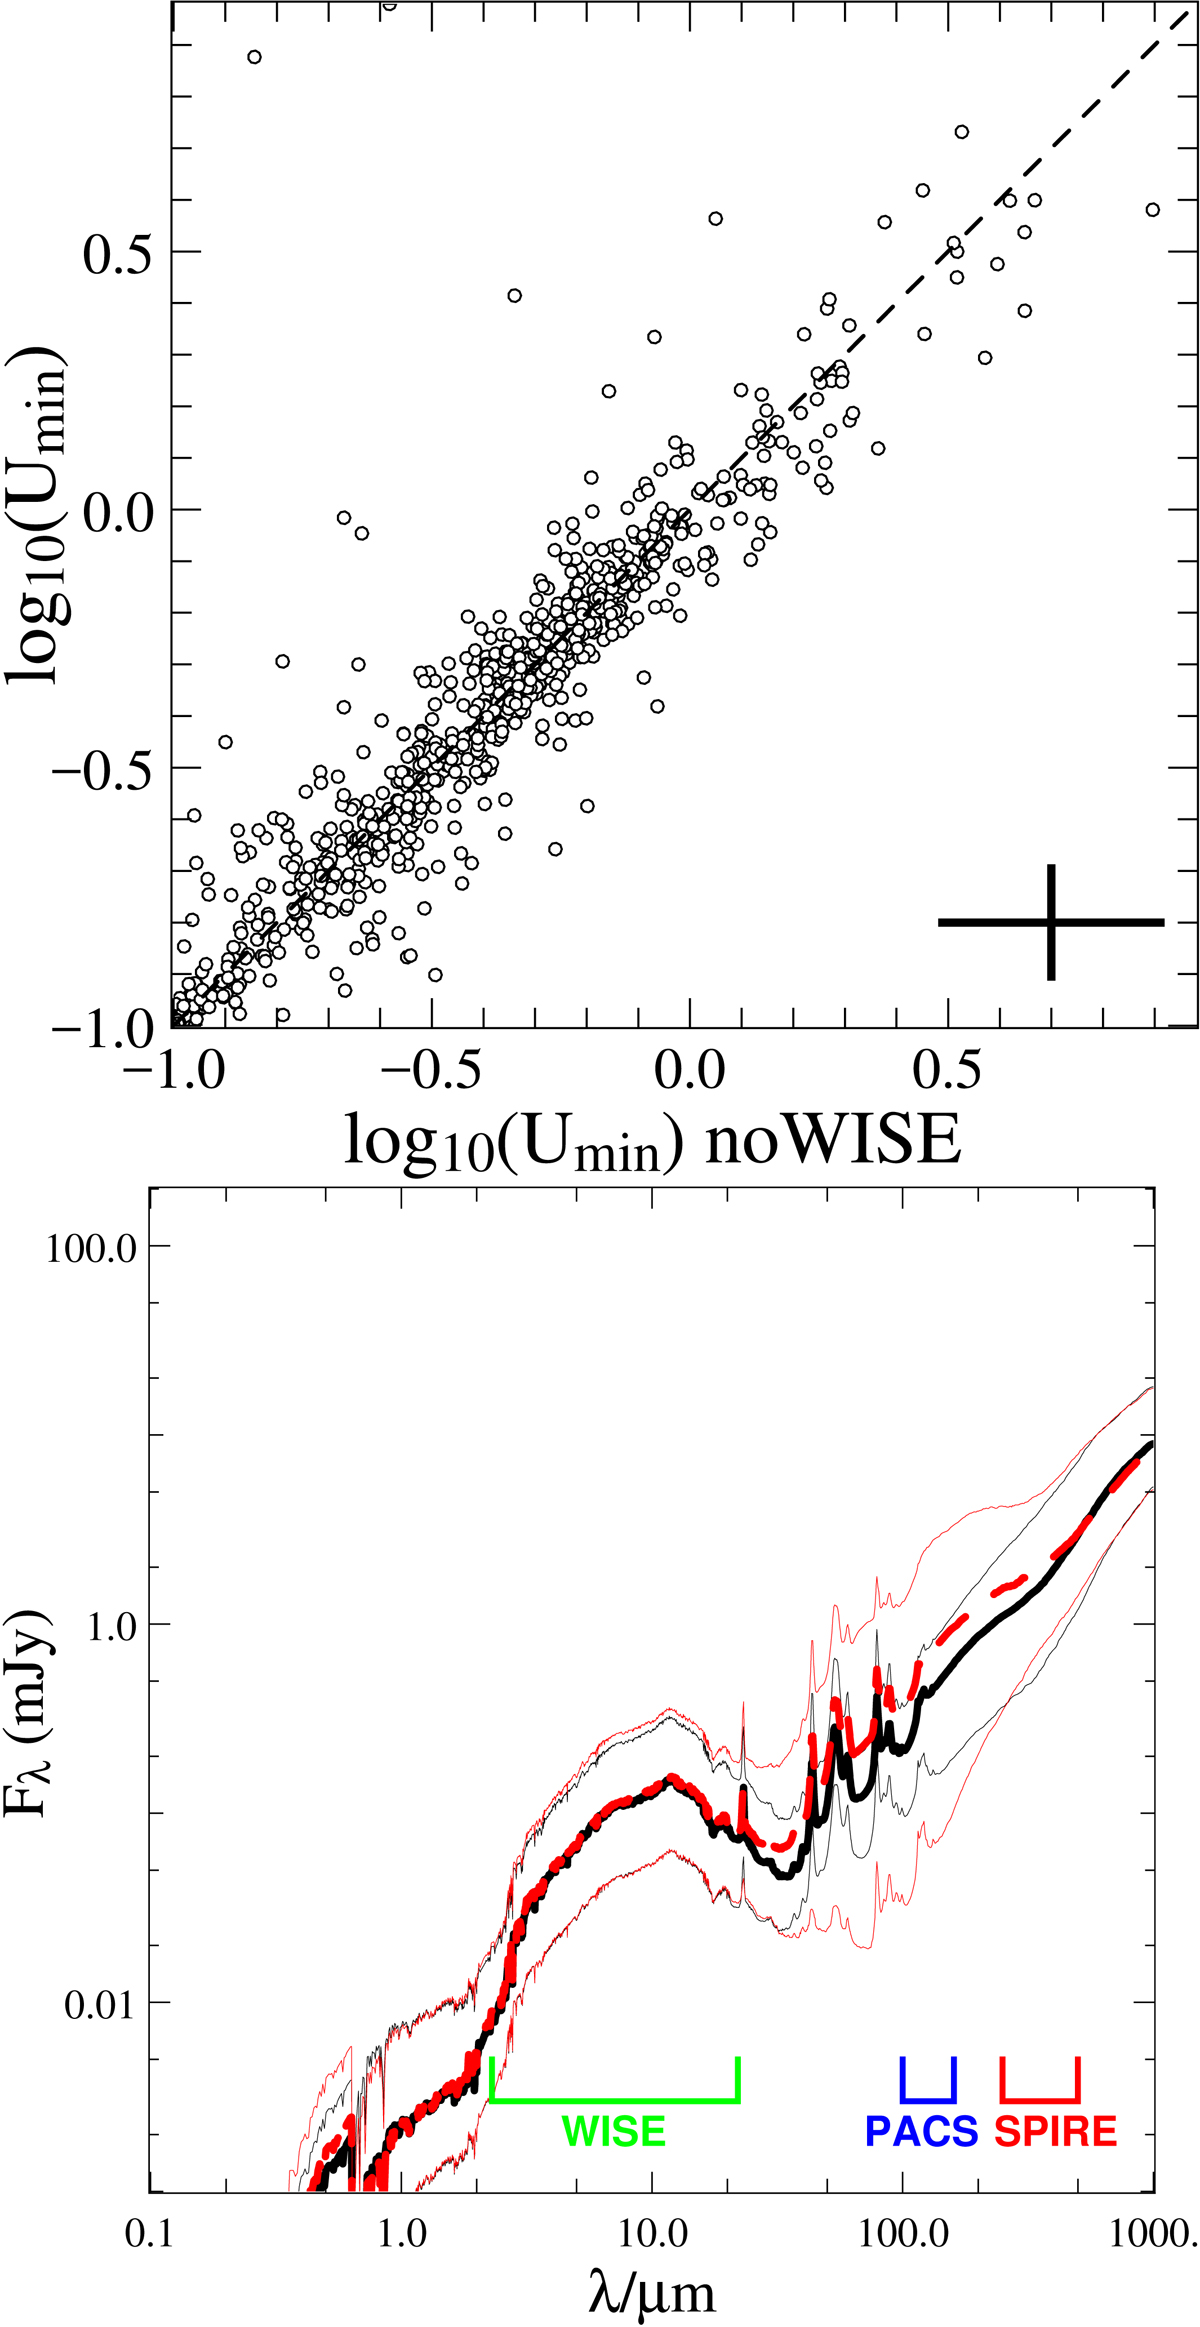
Fig. 2.
Download original image
Top panel: Umin parameter of Draine & Li (2007) obtained with CIGALE (Noll et al. 2009) using the full photometric coverage (ordinate) or removing WISE data (abscissa). Dashed lines show a linear correlation between the two quantities and the black cross in the bottom right corner shows the average errors in the fit. Bottom panel: median SED with 16th and 84th percentiles (ticker black solid line) obtained using the full photometric coverage (black solid) or removing WISE data (red dashed line). The photometric coverage of WISE, PACS, and SPIRE bands is shown at the bottom.
Current usage metrics show cumulative count of Article Views (full-text article views including HTML views, PDF and ePub downloads, according to the available data) and Abstracts Views on Vision4Press platform.
Data correspond to usage on the plateform after 2015. The current usage metrics is available 48-96 hours after online publication and is updated daily on week days.
Initial download of the metrics may take a while.