Fig. 11.
Download original image
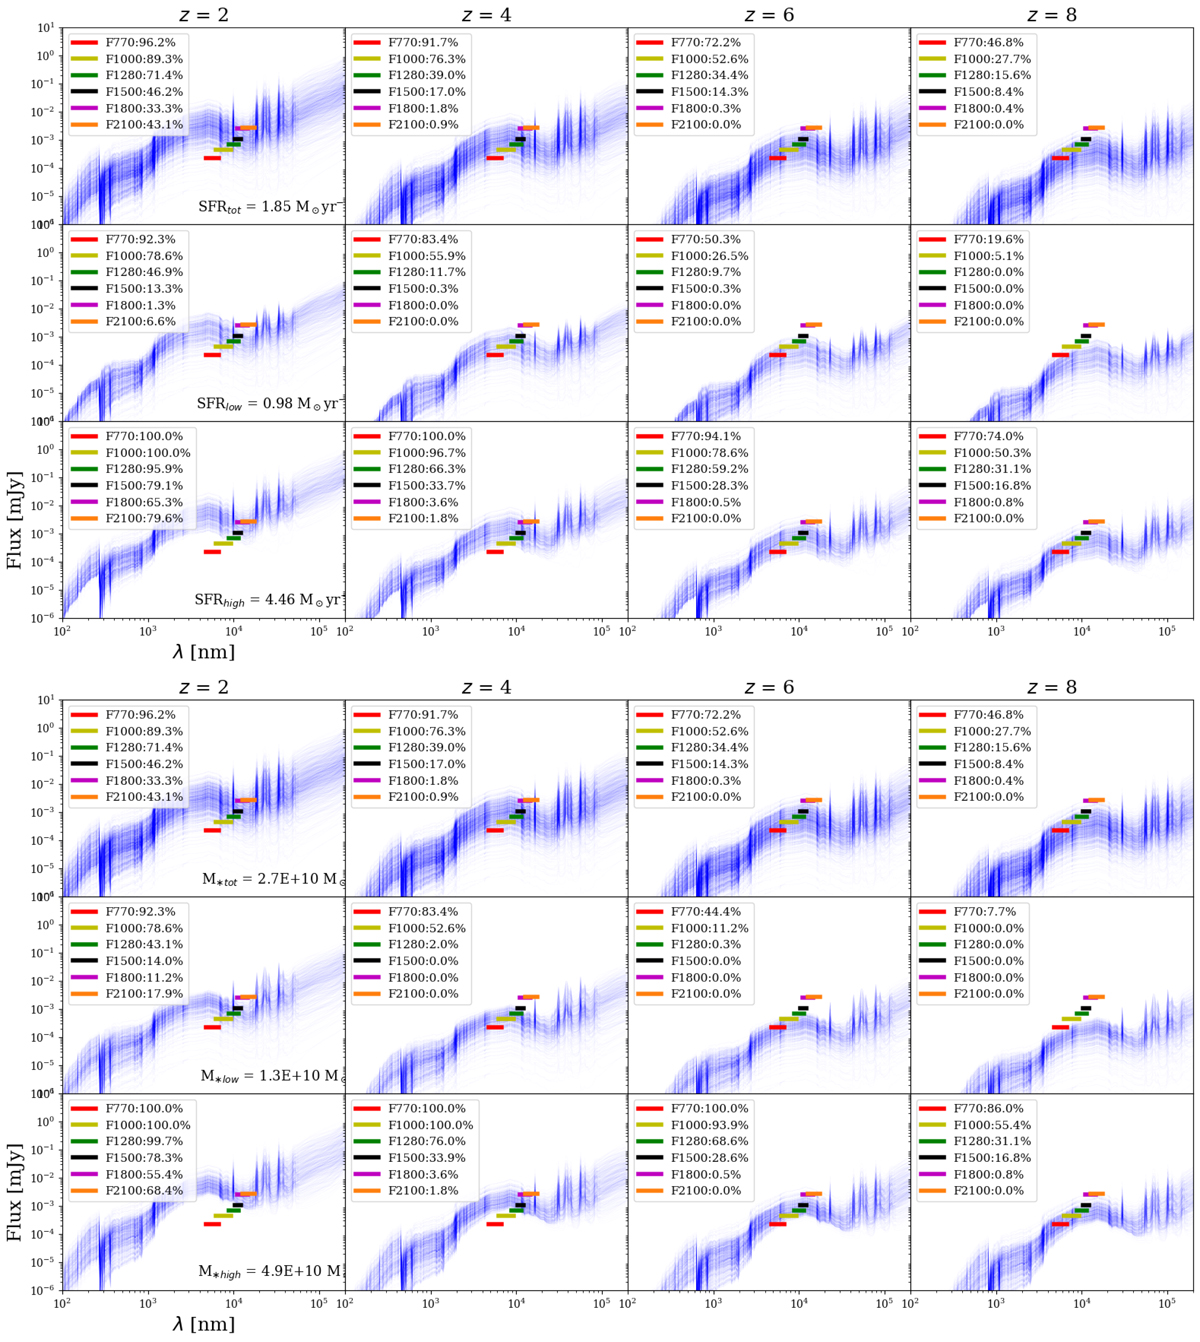
Top panels: best-fit SEDs of CIGALE at different redshifts, marked on top of each column. Coloured horizontal bars indicate the MIRI filters planned for the CEERS survey. Boxes on the left of each panel show the percentage of detection at a given filter. Galaxies are classified according to the SFR with the starting sample on the top row, the ‘low’ subsample in the middle, and the ‘high’ subsample on the bottom row. Median values of each sample are reported in the bottom right of the first panel in each row and Table 5. Bottom panel: same analysis selecting galaxies according to their stellar masses, as reported in Table 5.
Current usage metrics show cumulative count of Article Views (full-text article views including HTML views, PDF and ePub downloads, according to the available data) and Abstracts Views on Vision4Press platform.
Data correspond to usage on the plateform after 2015. The current usage metrics is available 48-96 hours after online publication and is updated daily on week days.
Initial download of the metrics may take a while.