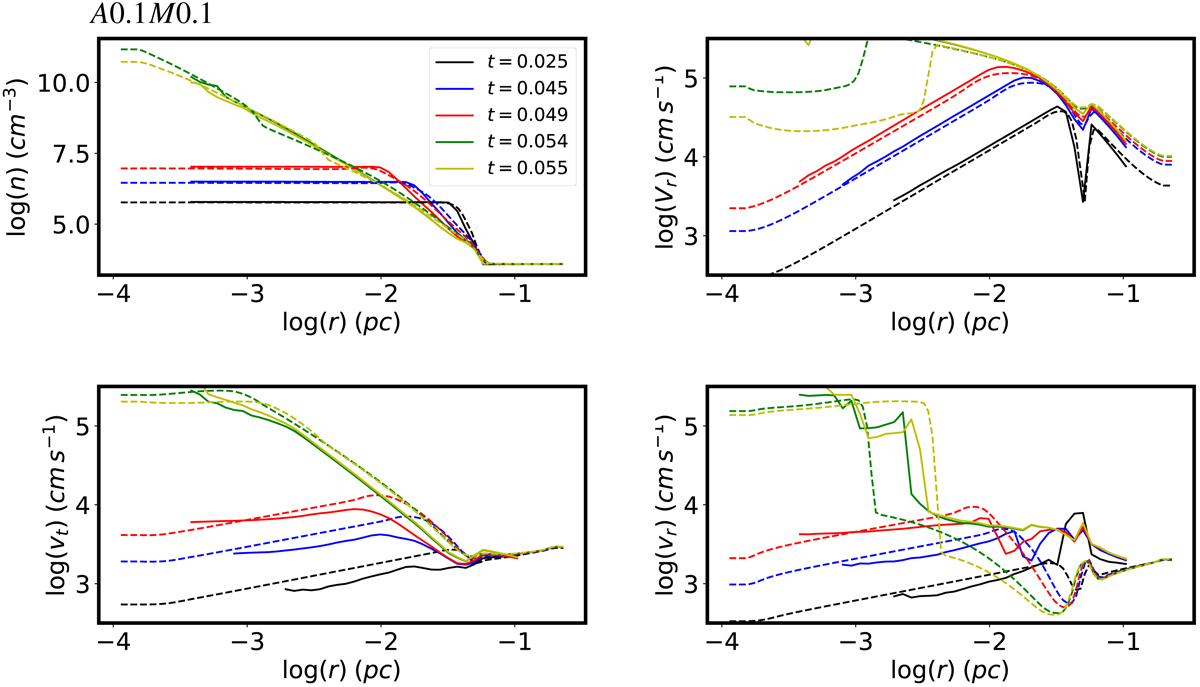
Fig. 6.
Download original image
Same as Fig. 2, but for run A0.1M0.1 (α = 0.1, ℳ = 0.1). Unlike in Fig. 5, Eqs. (18) and (19) were used to perform the 1D simulations. The agreement between the 1D (dashed lines) and 3D (solid lines) simulation results is overall very good and much better than when the local Jeans instability is not accounted for, as in Fig. 5.
Current usage metrics show cumulative count of Article Views (full-text article views including HTML views, PDF and ePub downloads, according to the available data) and Abstracts Views on Vision4Press platform.
Data correspond to usage on the plateform after 2015. The current usage metrics is available 48-96 hours after online publication and is updated daily on week days.
Initial download of the metrics may take a while.