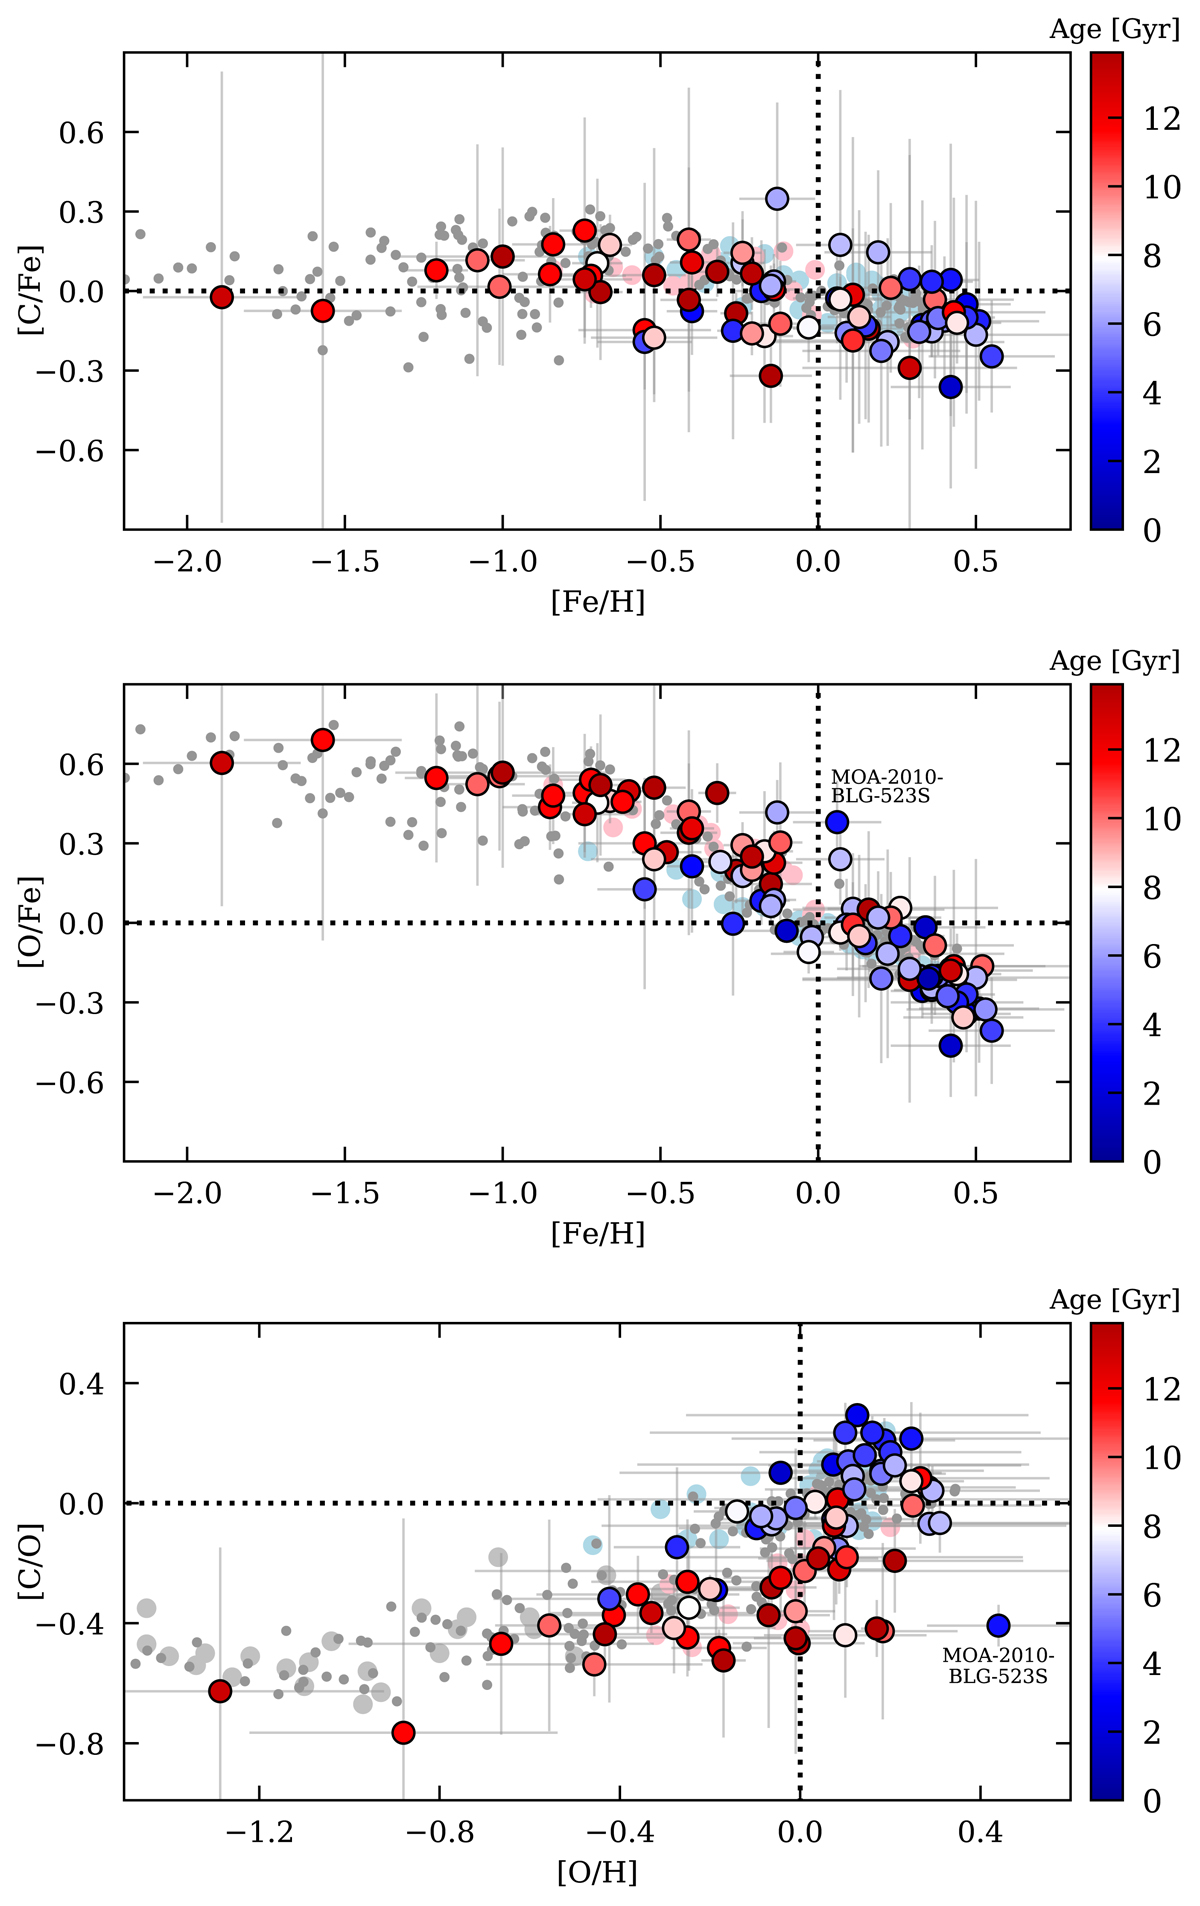
Fig. 8.
Download original image
[C/Fe] versus [Fe/H] (top panel), [O/Fe] versus [Fe/H] (middle panel), and [C/O] versus [O/H] (bottom panel) for the microlensed bulge dwarf sample. The bulge stars are colour-coded based on their ages, according to the colour bar on the right hand side. Light red circles and light blue dots are solar-neighbourhood thick- and thin-disk dwarf stars, respectively (oxygen based on the forbidden [O I] line at 6300 Å from Bensby et al. 2004, 2005 and carbon based on the forbidden [C I] line at 8727 Å from Bensby & Feltzing 2006). Large grey circles in the [C/H]–[O/H] plot are halo stars from Akerman et al. (2004), and small grey dots (in all plots) are the disk and halo stars (1D, NLTE results) from Amarsi et al. (2019b). In the oxygen plots, the positions of MOA-2010-BLG-523S are marked. In the carbon plot at the top, MOA-2010-BLG-523S has a [C/Fe] value very close to solar.
Current usage metrics show cumulative count of Article Views (full-text article views including HTML views, PDF and ePub downloads, according to the available data) and Abstracts Views on Vision4Press platform.
Data correspond to usage on the plateform after 2015. The current usage metrics is available 48-96 hours after online publication and is updated daily on week days.
Initial download of the metrics may take a while.