Fig. 7.
Download original image
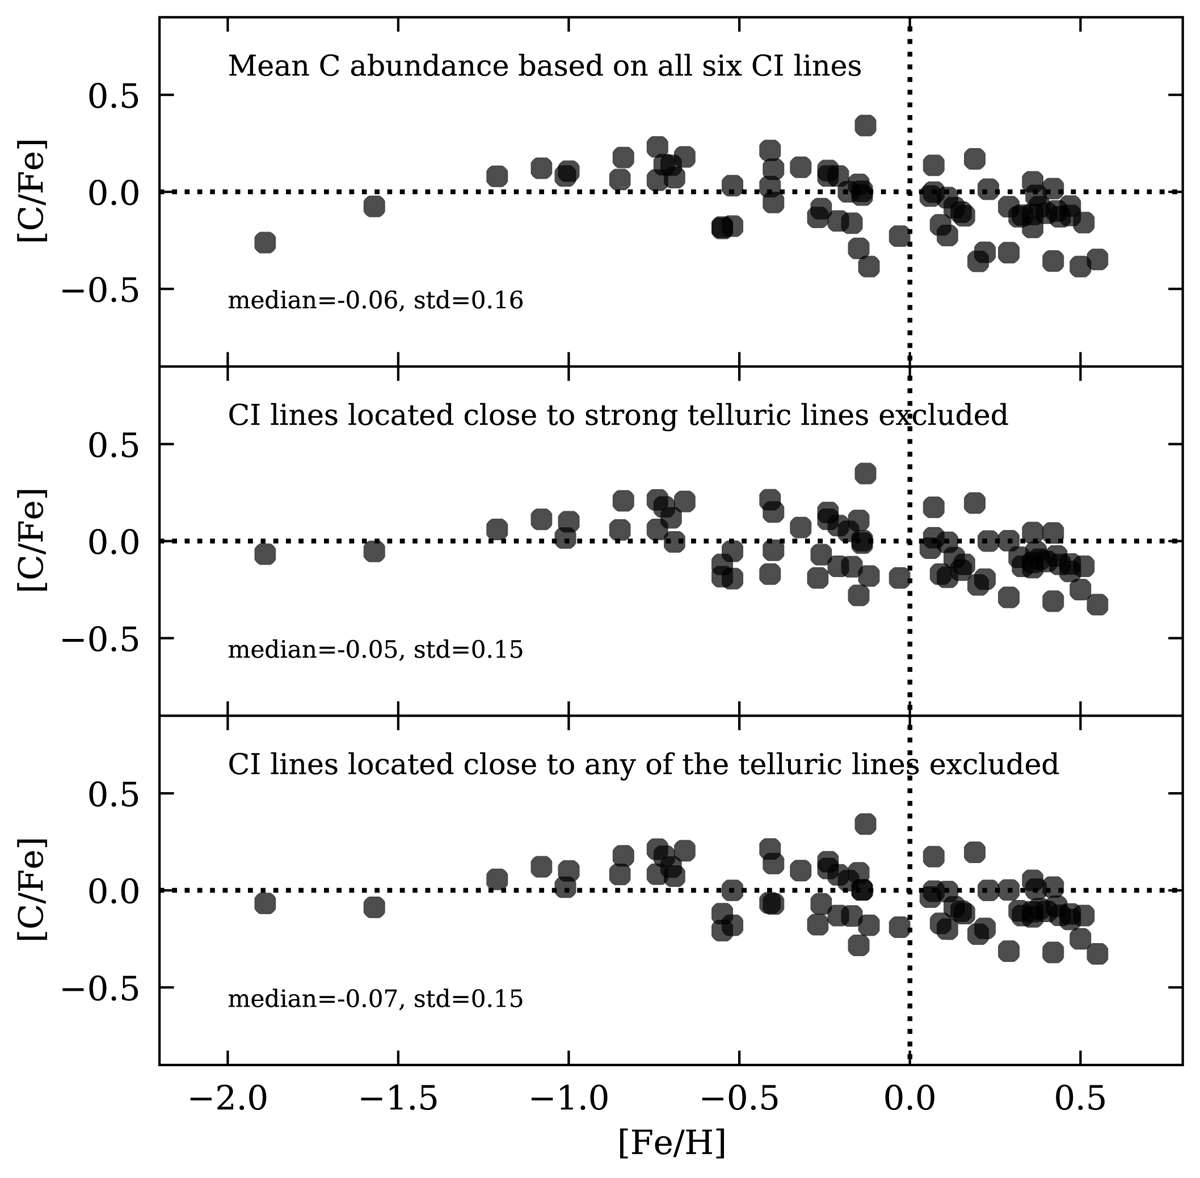
[C/Fe]–[Fe/H] trends where the carbon abundances are based on the mean abundance coming from the different C I lines. In the top plot, all C I lines are included in the calculation of the mean C abundance for each star; in the middle plot C I lines located close to strong telluric lines (red marked lines in Fig. 2) were excluded when calculating the mean C abundance for each star; and in the bottom plot, all C I lines located close to a telluric line (orange and red lines in Fig. 2 and orange and red points in Fig. 6) were excluded from the calculation of the mean C abundance for each star. In each plot, we also indicate the median [C/Fe] value and the dispersion in [C/Fe].
Current usage metrics show cumulative count of Article Views (full-text article views including HTML views, PDF and ePub downloads, according to the available data) and Abstracts Views on Vision4Press platform.
Data correspond to usage on the plateform after 2015. The current usage metrics is available 48-96 hours after online publication and is updated daily on week days.
Initial download of the metrics may take a while.