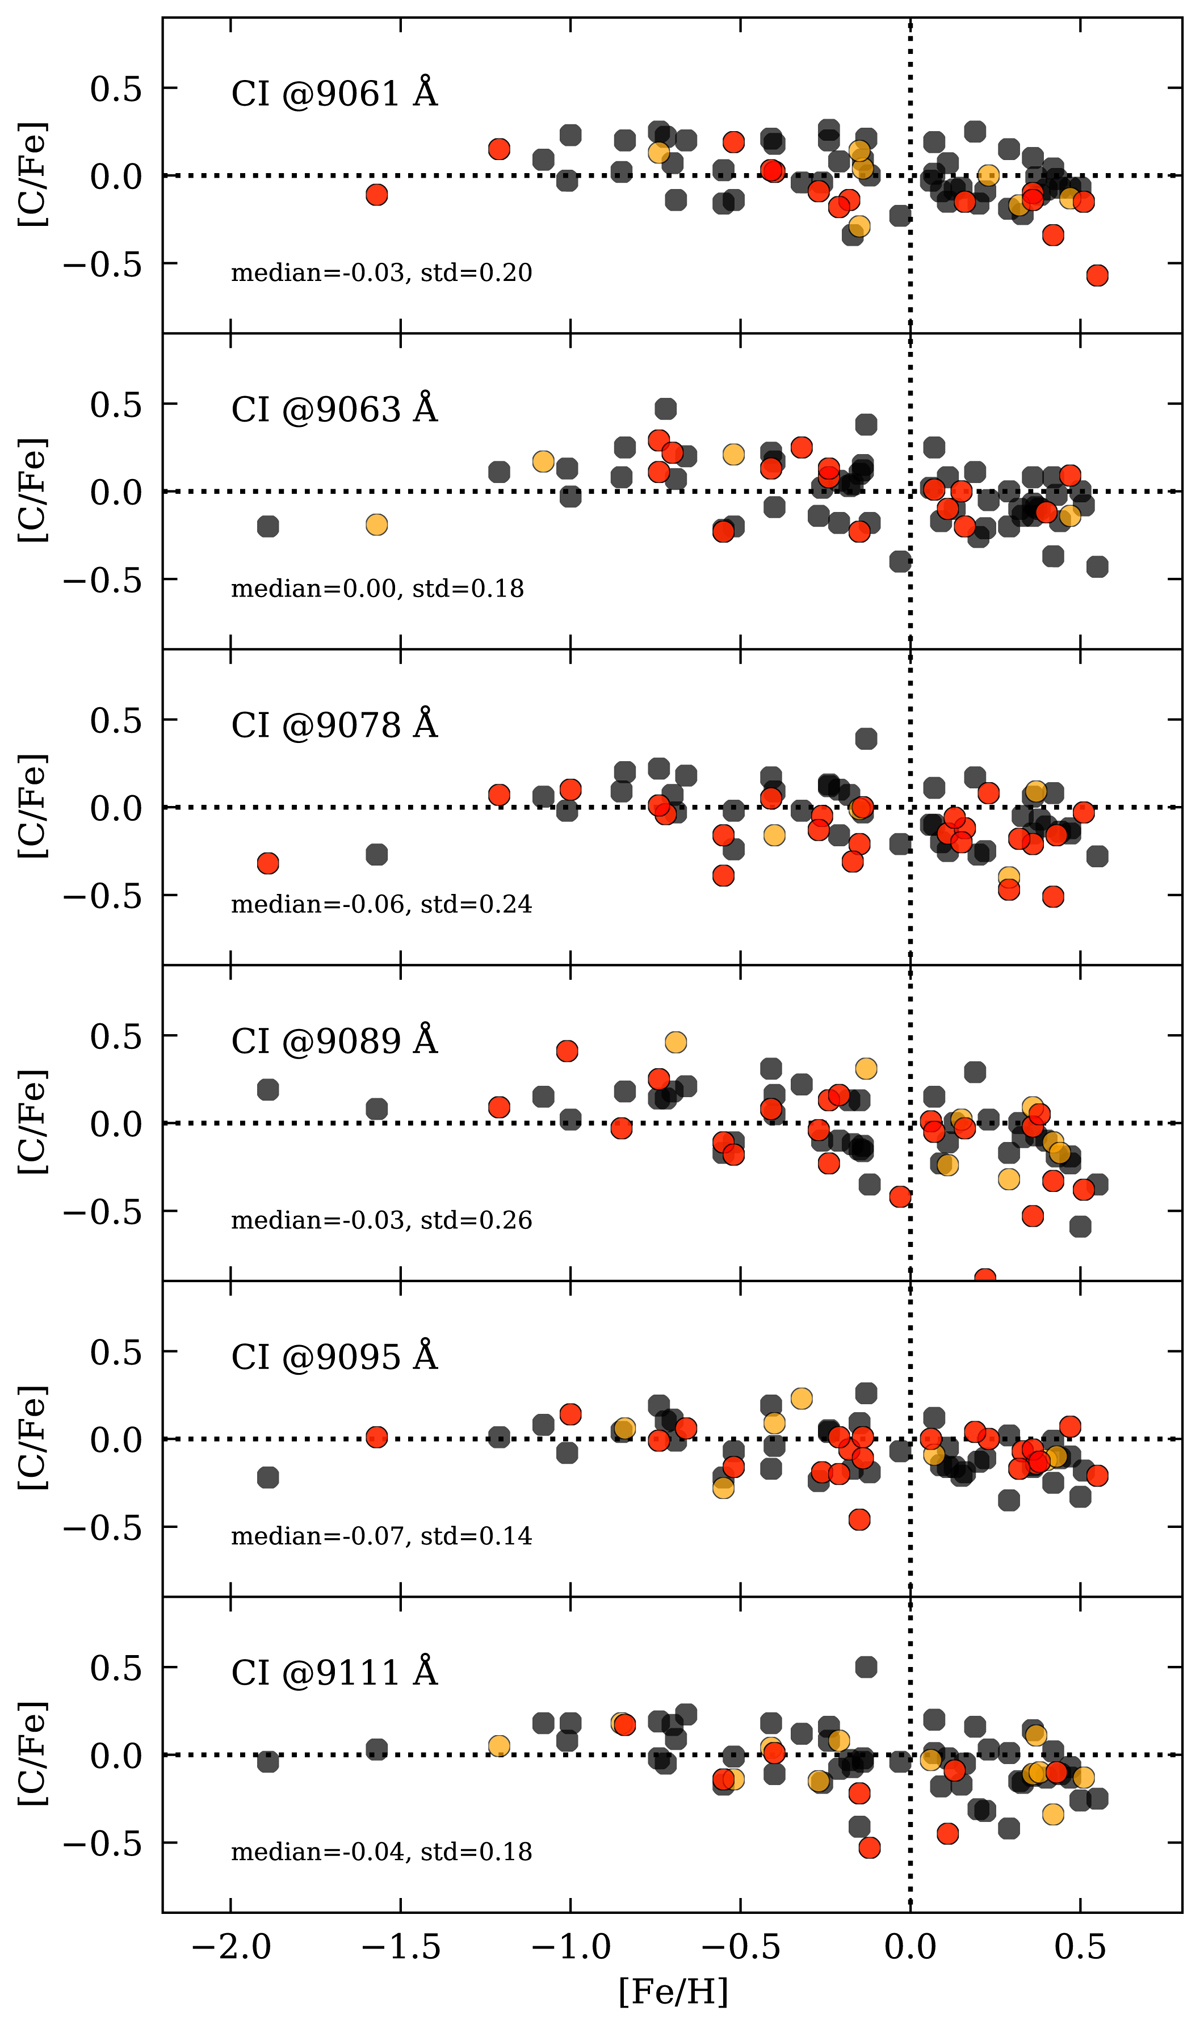
Fig. 6.
Download original image
[C/Fe]–[Fe/H] trend based on individual C I lines (as indicated in the plots). Black circles indicate that the C I line in question have not been affected by a telluric line, orange circles mean that the line in question has been located closer than 0.3 Å to a telluric line with a depth weaker than 15% of the continuum, and the red circles mean that the line in question is located closer than 0.3 Å to one of the stronger telluric lines. The telluric lines are marked in Fig. 2. In each plot, we also indicate the median [C/Fe] value and the dispersion in [C/Fe].
Current usage metrics show cumulative count of Article Views (full-text article views including HTML views, PDF and ePub downloads, according to the available data) and Abstracts Views on Vision4Press platform.
Data correspond to usage on the plateform after 2015. The current usage metrics is available 48-96 hours after online publication and is updated daily on week days.
Initial download of the metrics may take a while.