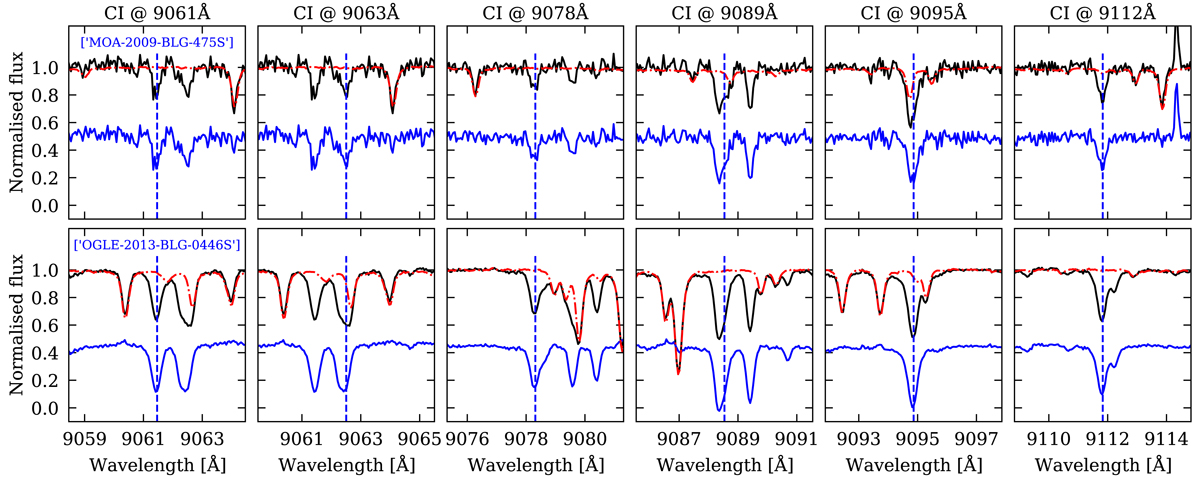
Fig. 3.
Download original image
C I lines in the 9060-9120 Å region. The top panel shows an example for MOA-2009-BLG-493S and the bottom panel an example for OGLE-2013-BLG-0446S. The black lines represent the observed spectrum, the red dash-dotted line represents a telluric template based on several observations of rapidly rotating B stars, and the blue lines represent the observed spectrum (vertically shifted for graphical reasons), after the removal of telluric features using the IRAF task TELLURIC. The vertical dashed lines mark the central wavelengths of the C I lines. We note that the spectra have been shifted to rest wavelengths and that the telluric lines will contaminate different lines depending on the radial velocity of the star.
Current usage metrics show cumulative count of Article Views (full-text article views including HTML views, PDF and ePub downloads, according to the available data) and Abstracts Views on Vision4Press platform.
Data correspond to usage on the plateform after 2015. The current usage metrics is available 48-96 hours after online publication and is updated daily on week days.
Initial download of the metrics may take a while.