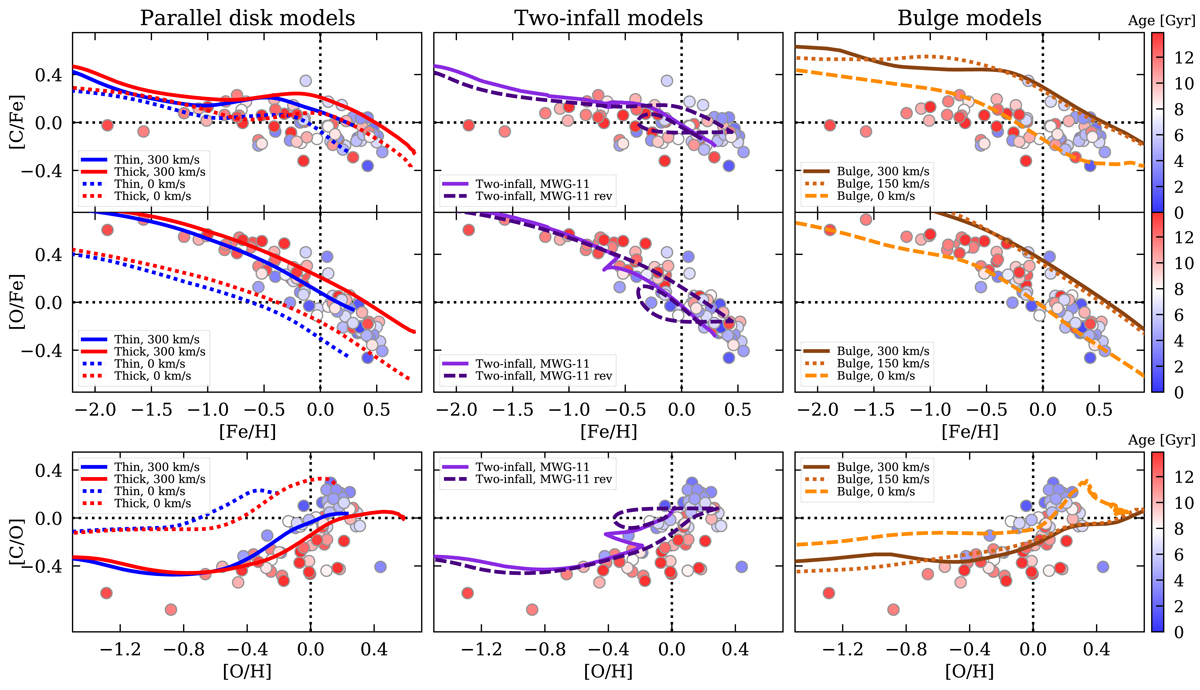
Fig. 10.
Download original image
Comparisons of the observed carbon and oxygen abundance trends to the different GCE models from Romano et al. (2020). Left hand side plots: Parallel model for thin disk (blue lines) and thick disk (red lines) by Grisoni et al. (2017) with updated stellar nucleosynthetic yields from Romano et al. (2019), here for massive stars rotating at either zero (dotted lines) or 300 km s−1 (solid lines). Middle plots: Two-infall MWG-11 model from Romano et al. (2019) but revised according to the prescriptions in Spitoni et al. (2019) (dark purple dashed lines) and without the revision by Spitoni et al. (2019) (solid purple lines). Right hand side plots: Bulge models by Matteucci et al. (2019) with the nucleosynthetic yields of the MWG-05, MWG-06, and MWG-07 models by Romano et al. (2019), which includes rapidly rotating massive stars at 300, 150, and 0 km s−1, respectively.
Current usage metrics show cumulative count of Article Views (full-text article views including HTML views, PDF and ePub downloads, according to the available data) and Abstracts Views on Vision4Press platform.
Data correspond to usage on the plateform after 2015. The current usage metrics is available 48-96 hours after online publication and is updated daily on week days.
Initial download of the metrics may take a while.