Fig. 9
Download original image
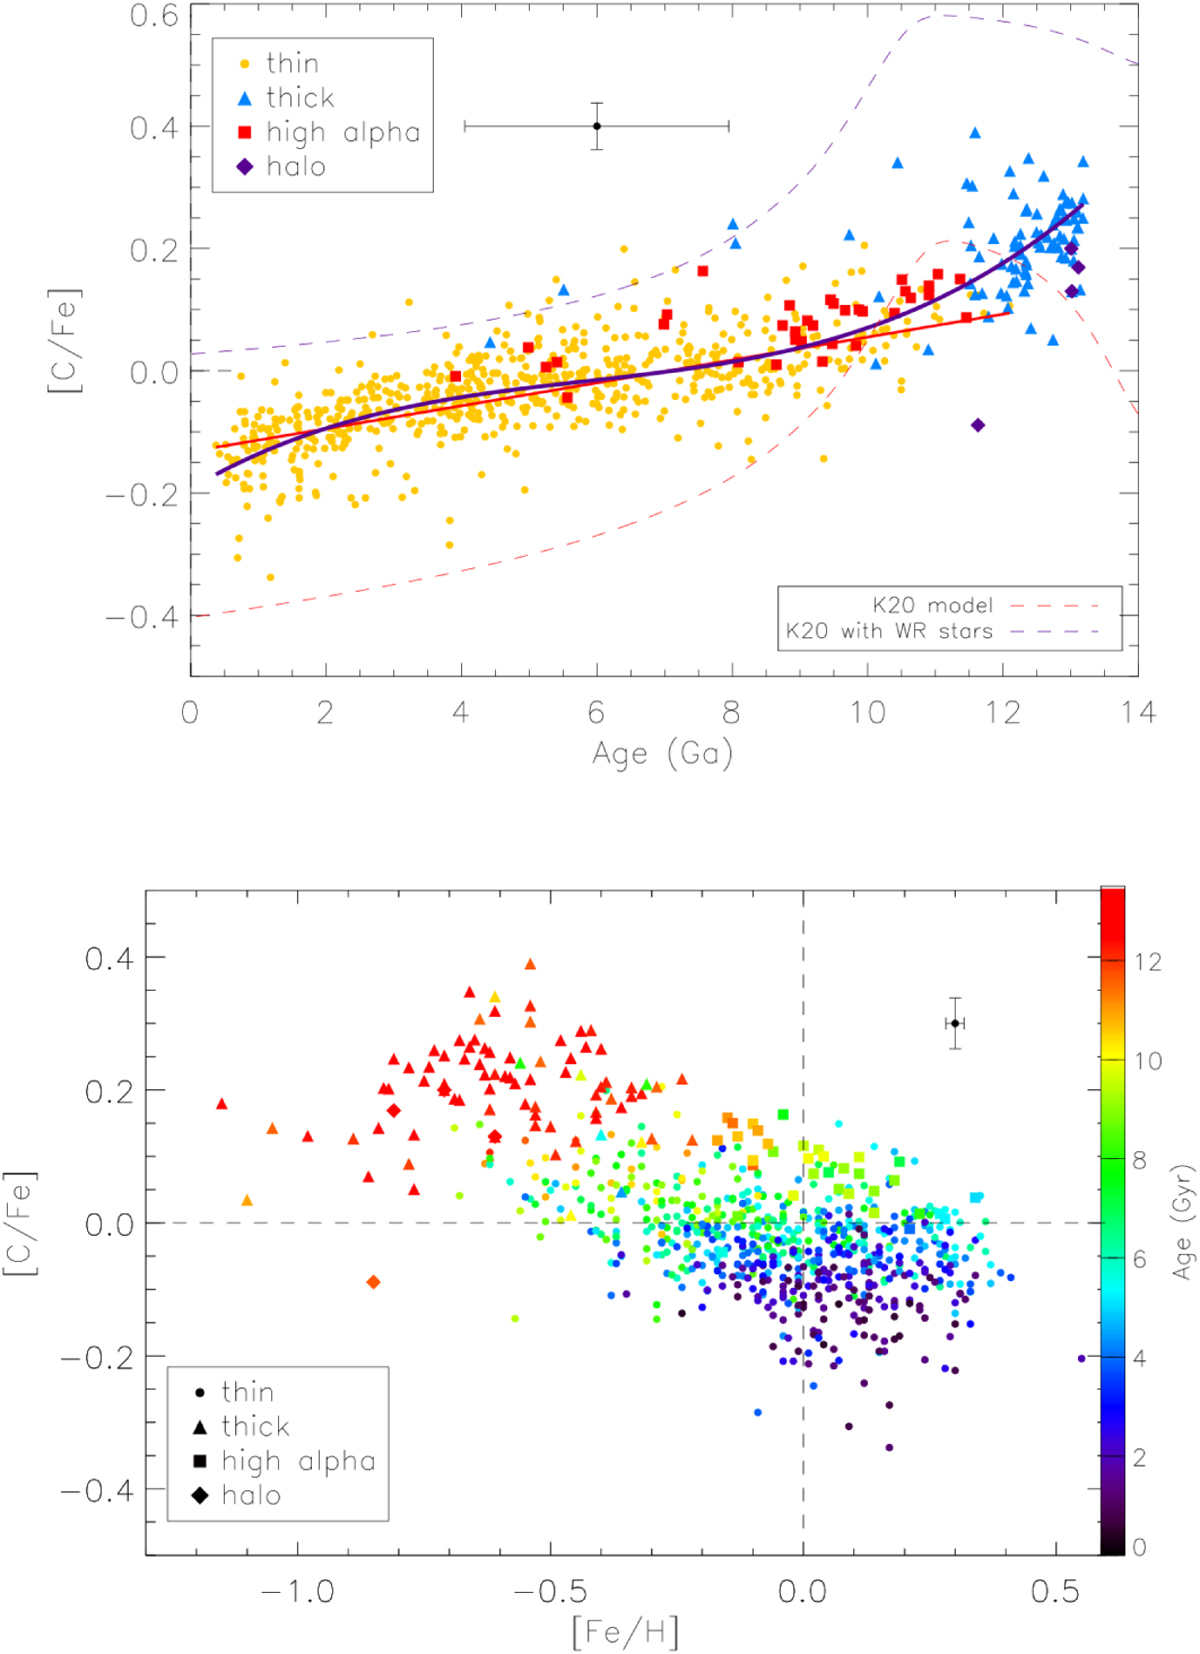
[C/Fe] relation with age. Upper panel: [C/Fe] ratios as a function of age for the full sample. The red line is a weighted (by uncertainties) linear fit to the thin-disk stars to guide the eye on the general behaviour of the trend. The thick purpleline is a weighted fit with a third-order polynomial for all the stars. The dashed lines are the Kobayashi models also depicted in Fig. 3. Lower panel: [C/Fe] as a function of [Fe/H] with ages in colour scale.
Current usage metrics show cumulative count of Article Views (full-text article views including HTML views, PDF and ePub downloads, according to the available data) and Abstracts Views on Vision4Press platform.
Data correspond to usage on the plateform after 2015. The current usage metrics is available 48-96 hours after online publication and is updated daily on week days.
Initial download of the metrics may take a while.