Fig. 13
Download original image
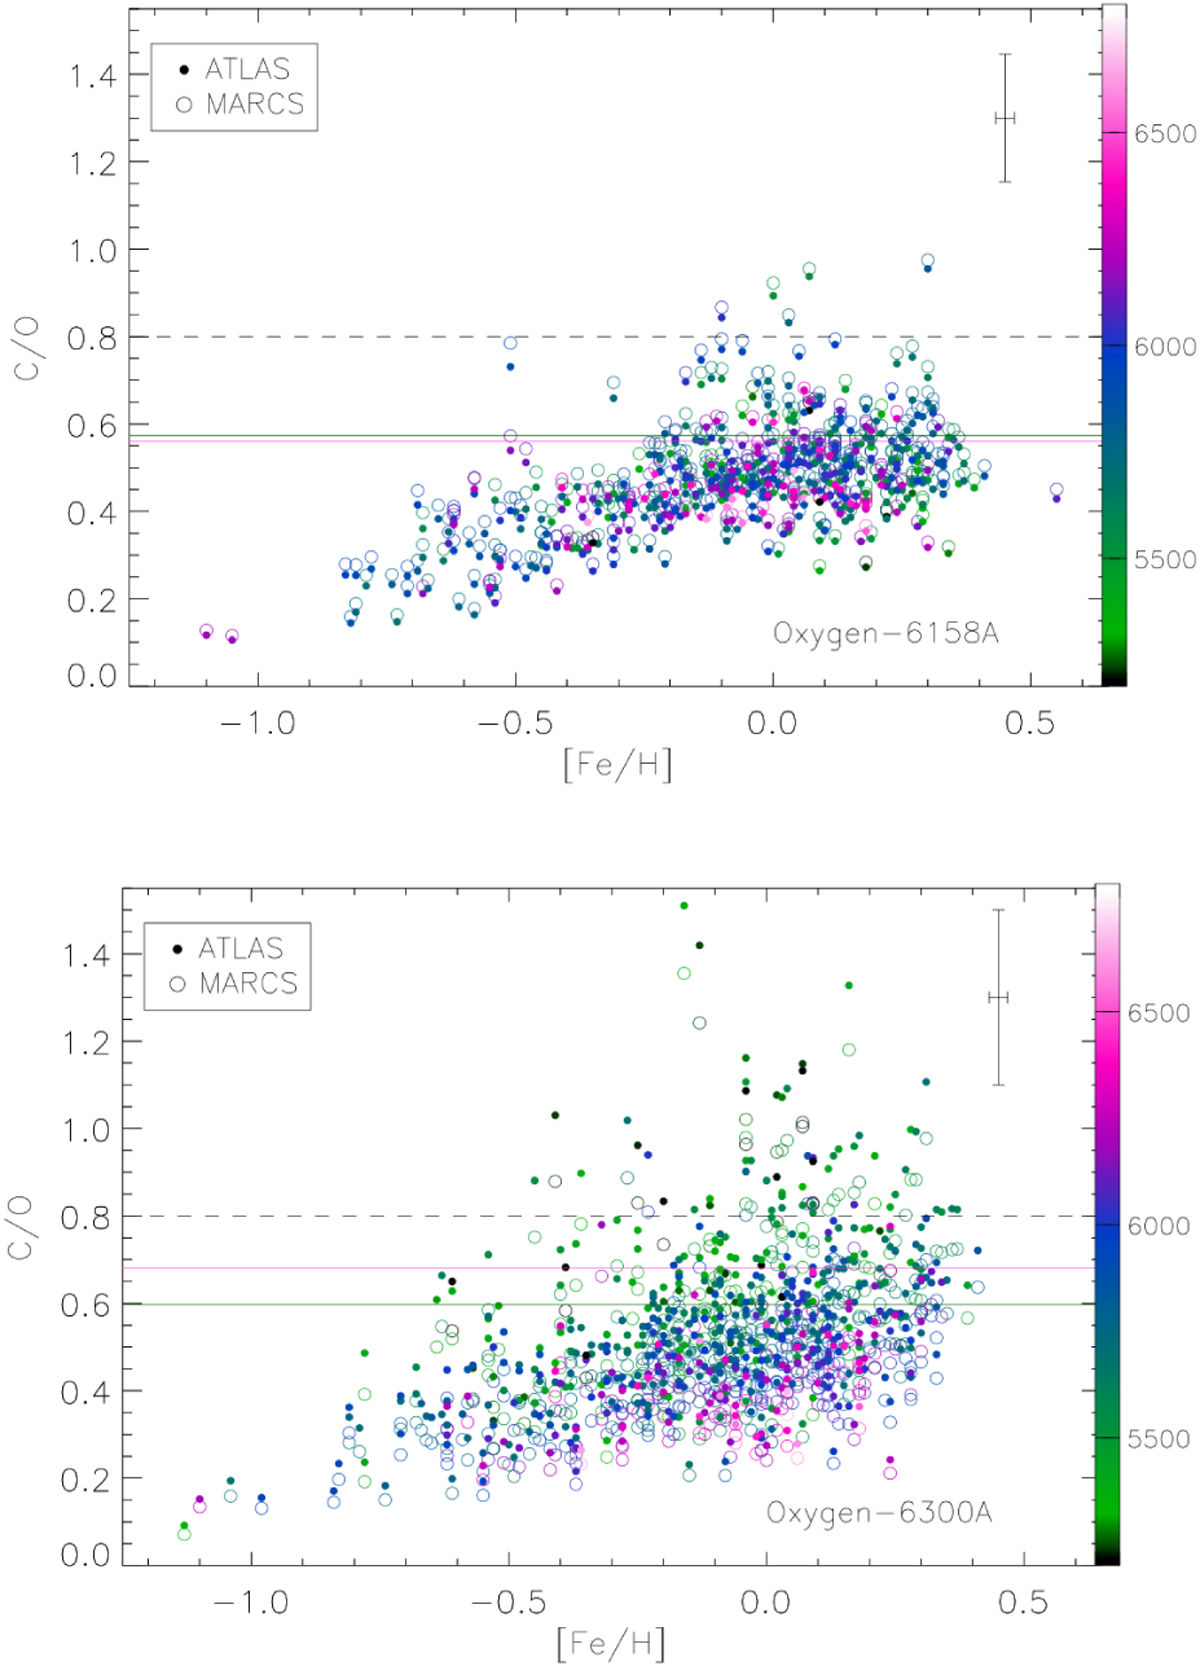
C/O elemental ratios as a function of [Fe/H] for both oxygen indicators using abundances derived with ATLAS models (filled circles) or MARCS models (open circles). The Teff of each star is depicted with a colour scale. The magenta and green continuous lines marks the solar C/O value for ATLAS and MARCS models, respectively. The black dashed line marks the limit of C/O values above which planets are considered as carbon-rich.
Current usage metrics show cumulative count of Article Views (full-text article views including HTML views, PDF and ePub downloads, according to the available data) and Abstracts Views on Vision4Press platform.
Data correspond to usage on the plateform after 2015. The current usage metrics is available 48-96 hours after online publication and is updated daily on week days.
Initial download of the metrics may take a while.