Fig. 7
Download original image
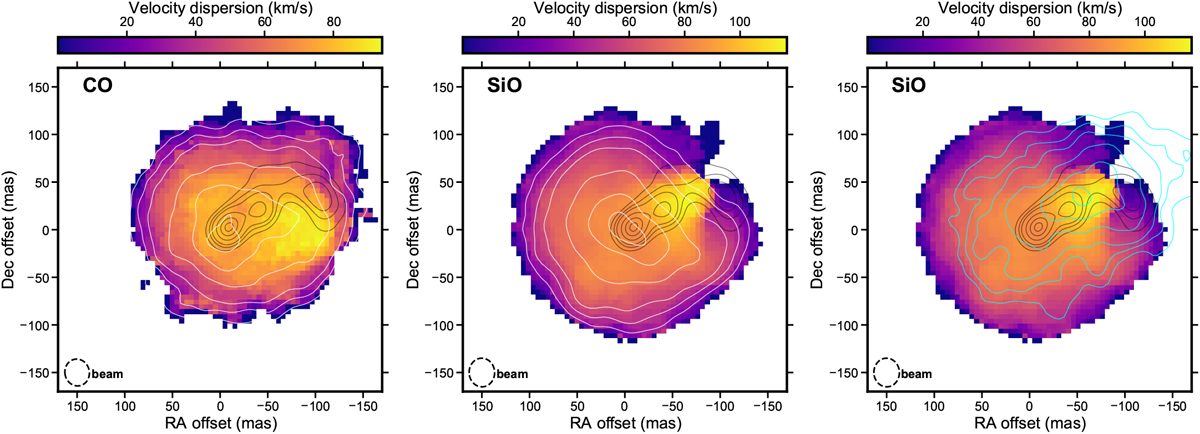
Second-moment maps for molecular lines of CO 2–1 and SiO 5–4. White contours show the total intensity of any given line. Gray contours show continuum emission. Cyan contours in the right panel show total intensity of the SO2 and H2S blend. Contours are drawn at 0.2, 0.3, 0.4, 0.6, 0.8, and 0.95 times the peak flux. The maps were produced with natural weighting ofvisibilities.
Current usage metrics show cumulative count of Article Views (full-text article views including HTML views, PDF and ePub downloads, according to the available data) and Abstracts Views on Vision4Press platform.
Data correspond to usage on the plateform after 2015. The current usage metrics is available 48-96 hours after online publication and is updated daily on week days.
Initial download of the metrics may take a while.