Fig. 3
Download original image
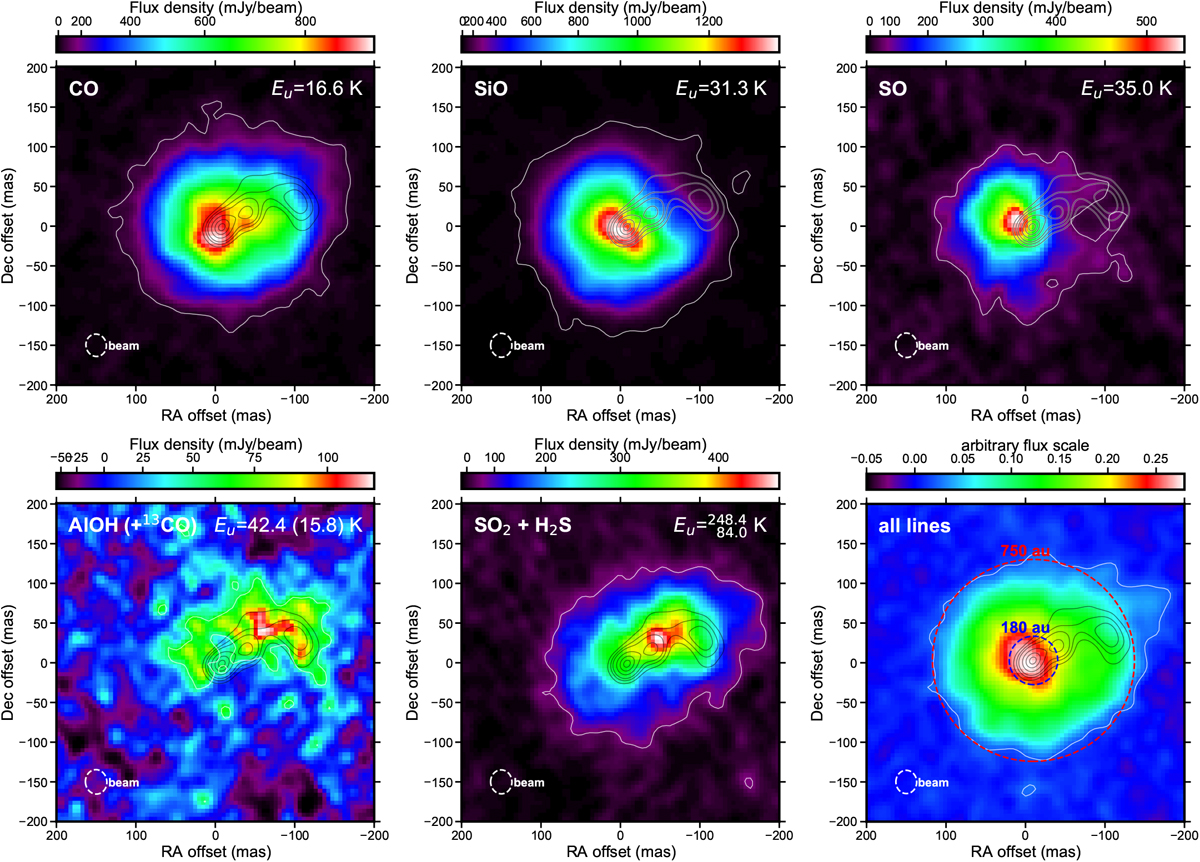
Total intensity maps of the molecular emission in V838 Mon. A white contour is drawn at the 3σ noise level of each map. Gray contours show continuum emission at 0.2, 0.3, 0.4, 0.6, 0.8, and 0.95 times the peak level. All maps were reconstructed with natural weighting. Bottom left and middle panels: maps for blended transitions. The energy of the upper level of the mapped transitions is indicated on each map. Bottom right panel: emission in all lines covered by ALMA. The red dashed circle of a radius of 750 au serves as a reference for the physical scale.
Current usage metrics show cumulative count of Article Views (full-text article views including HTML views, PDF and ePub downloads, according to the available data) and Abstracts Views on Vision4Press platform.
Data correspond to usage on the plateform after 2015. The current usage metrics is available 48-96 hours after online publication and is updated daily on week days.
Initial download of the metrics may take a while.