Fig. 8
Download original image
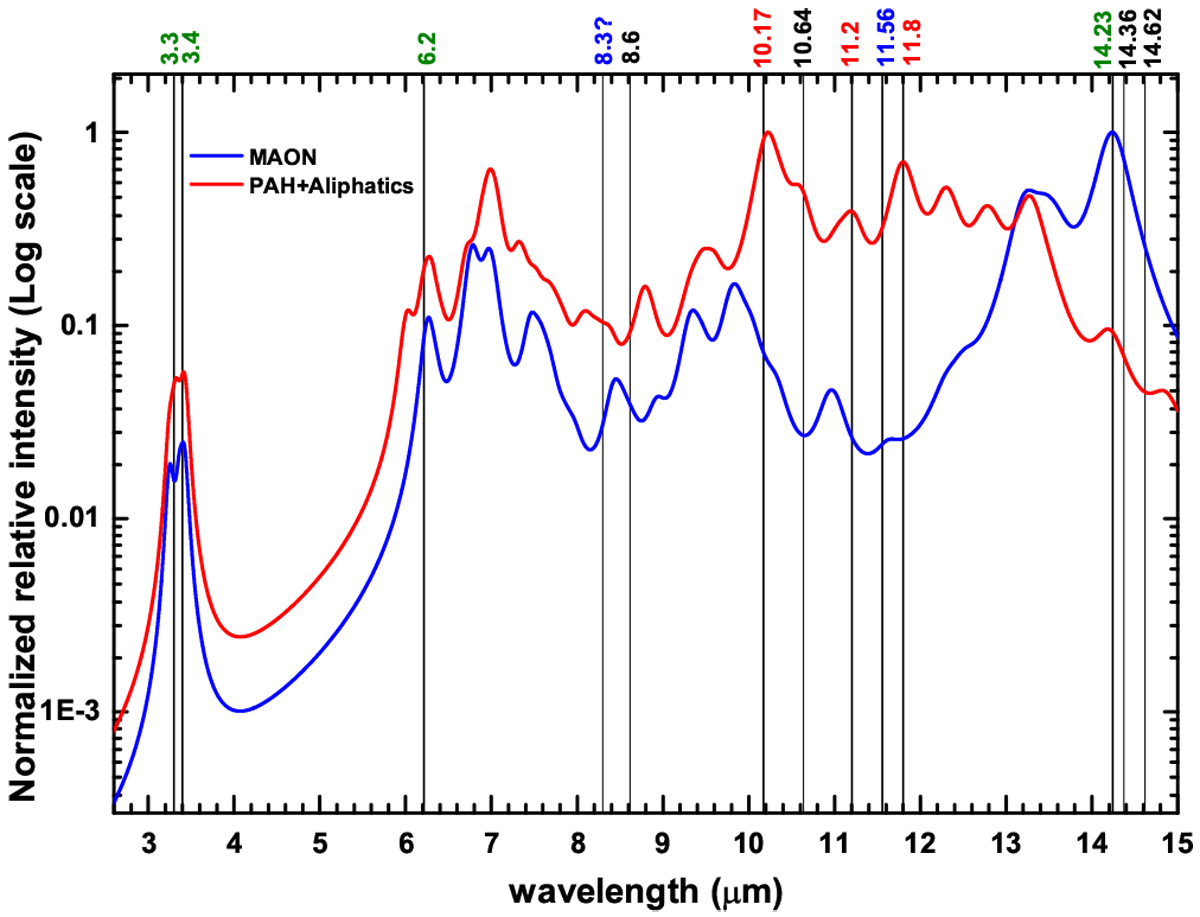
Theoretically simulated IR spectra of two molecular structures with C15H16 formula at T = 500 K. The blue and red profiles represent MAON (1,3-diphenylpropane; Fig. 7a) and PAH with aliphatic side groups (Fig. 7b). A quantum chemical model of B3LYP/PC1 is applied to calculate the vibrational normal modes. The solid black lines indicate the positions of the UIE features seen in Hb 12. The positions of UIE features marked with green, blue, red, and black colours indicate the bands reproduced by both models, by the MAON model and the PAH+aliphatics model, and by none of the models, respectively.
Current usage metrics show cumulative count of Article Views (full-text article views including HTML views, PDF and ePub downloads, according to the available data) and Abstracts Views on Vision4Press platform.
Data correspond to usage on the plateform after 2015. The current usage metrics is available 48-96 hours after online publication and is updated daily on week days.
Initial download of the metrics may take a while.