Fig. 5
Download original image
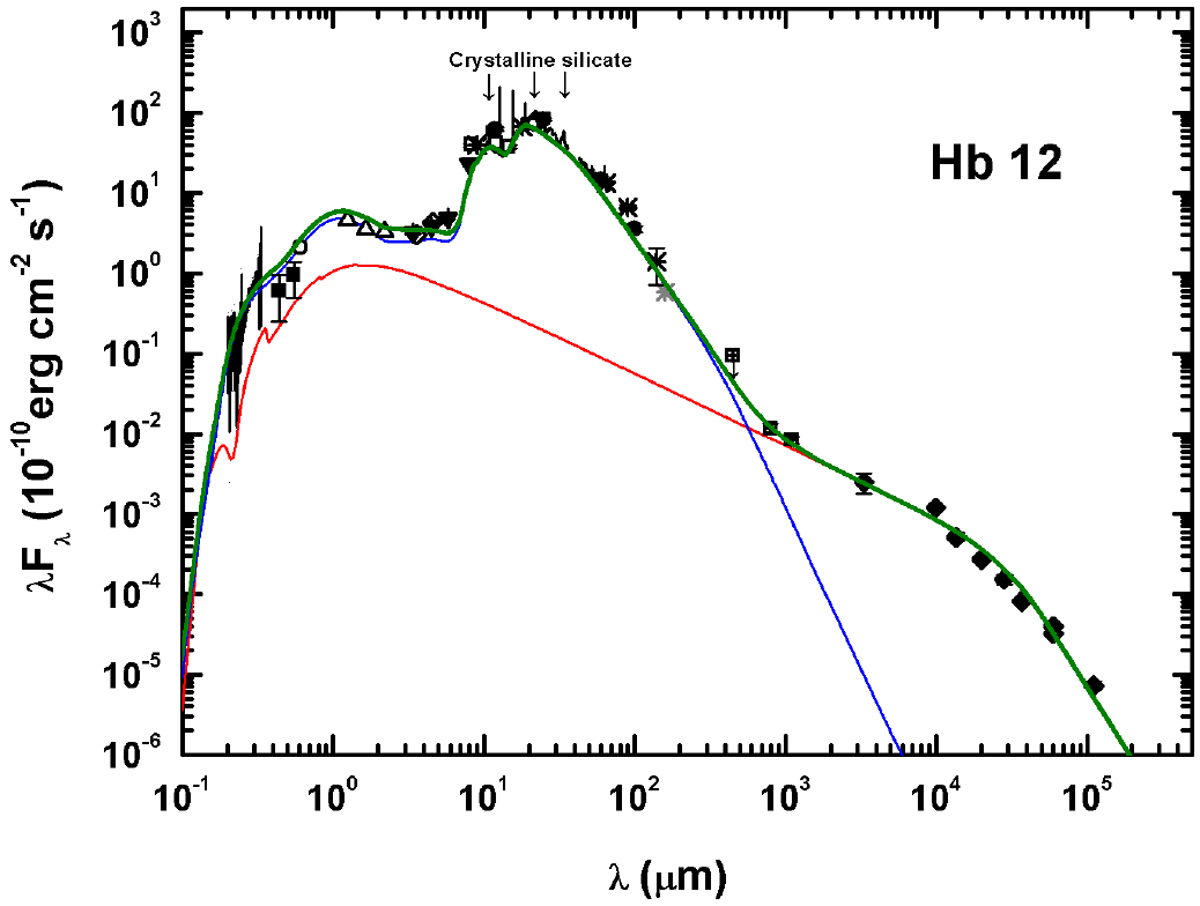
SED of Hb 12 covering the wavelength range from the uv to the radio. Filled squares and open circle show the B, V, and Ru photometric results. The open triangles, filled triangles, open diamonds, open squares, filled circles, asterisks, crossed squares, and filled diamonds show 2MASS, Spitzer, WISE, MSX, IRAS, AKARI, JCMT, and available radio measurements, respectively. The unreliable AKARI detection is shown as light grey asterisk. The flux measured from JCMT at 450 μm represents an upper limit detection. The spectra with IUE, ISO LWS, and SWS are also plotted. Broad silicate features at 9.7, 18, 23, 28, and 33 μm are also marked. The red and blue curves represent the gaseous continuum and the emergent fluxes estimated by using a dust radiative transfer model, respectively. The sum of fluxes emitted from all components is plotted as a green curve.
Current usage metrics show cumulative count of Article Views (full-text article views including HTML views, PDF and ePub downloads, according to the available data) and Abstracts Views on Vision4Press platform.
Data correspond to usage on the plateform after 2015. The current usage metrics is available 48-96 hours after online publication and is updated daily on week days.
Initial download of the metrics may take a while.