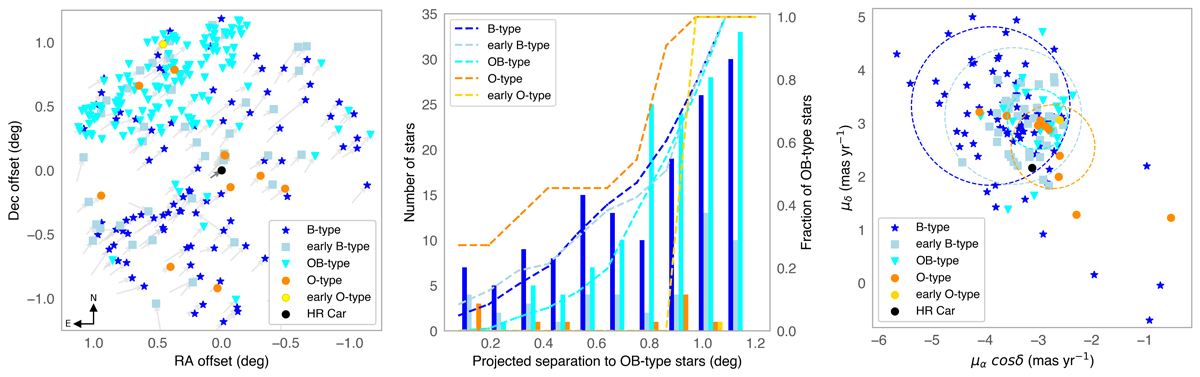
Fig. 4.
Download original image
Left: spatial distribution of all O- and B-type stars in a projected region with radius r = 1.2° around HR Car (black filled circle in the center), based on information retrieved from Simbad and Gaia. The newly classified B-type stars in the MUSE data are not listed in Simbad and not included of this figure. The arrows indicate the movement of the stars in the past 105 yr, inferred from available Gaia proper motions. HR Car moves in the same general direction as other massive stars in this region of the sky. Middle: projected separation to O- and B-type stars and the normalized cumulative distribution (dashed curves). Right: vector point diagram for O- and B-type stars using Gaia proper motions. The dashed circles indicate two standard deviations of the mean of the proper motions for the respective stellar subgroups. HR Car’s location (black filled circle at the center of the plot) is within two standard deviations of the mean of the proper motions for O-type, early B-type, and B-type stars.
Current usage metrics show cumulative count of Article Views (full-text article views including HTML views, PDF and ePub downloads, according to the available data) and Abstracts Views on Vision4Press platform.
Data correspond to usage on the plateform after 2015. The current usage metrics is available 48-96 hours after online publication and is updated daily on week days.
Initial download of the metrics may take a while.