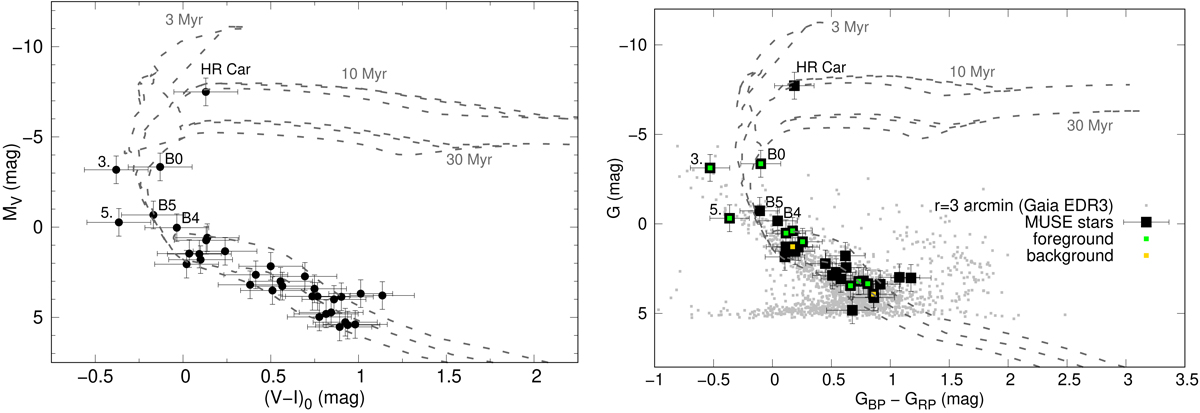
Fig. 3.
Download original image
Left: color-magnitude diagram of the hot stars within a 2′×2′ region around HR Car derived from MUSE data and synthetic photometry, assuming a distance of d = 4.8 kpc to all sources and corrected for an extinction of AV = 2.9 mag. The errors are dominated by the uncertainties of the reddening and distance estimates. PARSEC theoretical single-star stellar evolution isochrones are shown for 3 Myr, 10 Myr, and 30 Myr (dashed gray curves; Bressan et al. 2012). The stars 3. and 5. are foreground stars. Right: same as left figure, but with Gaia EDR3 photometry. Stars with estimated higher geometric distance limits of dgeo_h < 4448 pc are indicated as foreground stars (green squares) and stars with estimated lower geometric distance limits of dgeo_l > 5098 pc as background stars (golden squares). The other sources (black filled squares only) are at an inferred distance compatible with that of HR Car. The gray small squares show all Gaia sources within an area of radius r = 3′ from HR Car.
Current usage metrics show cumulative count of Article Views (full-text article views including HTML views, PDF and ePub downloads, according to the available data) and Abstracts Views on Vision4Press platform.
Data correspond to usage on the plateform after 2015. The current usage metrics is available 48-96 hours after online publication and is updated daily on week days.
Initial download of the metrics may take a while.