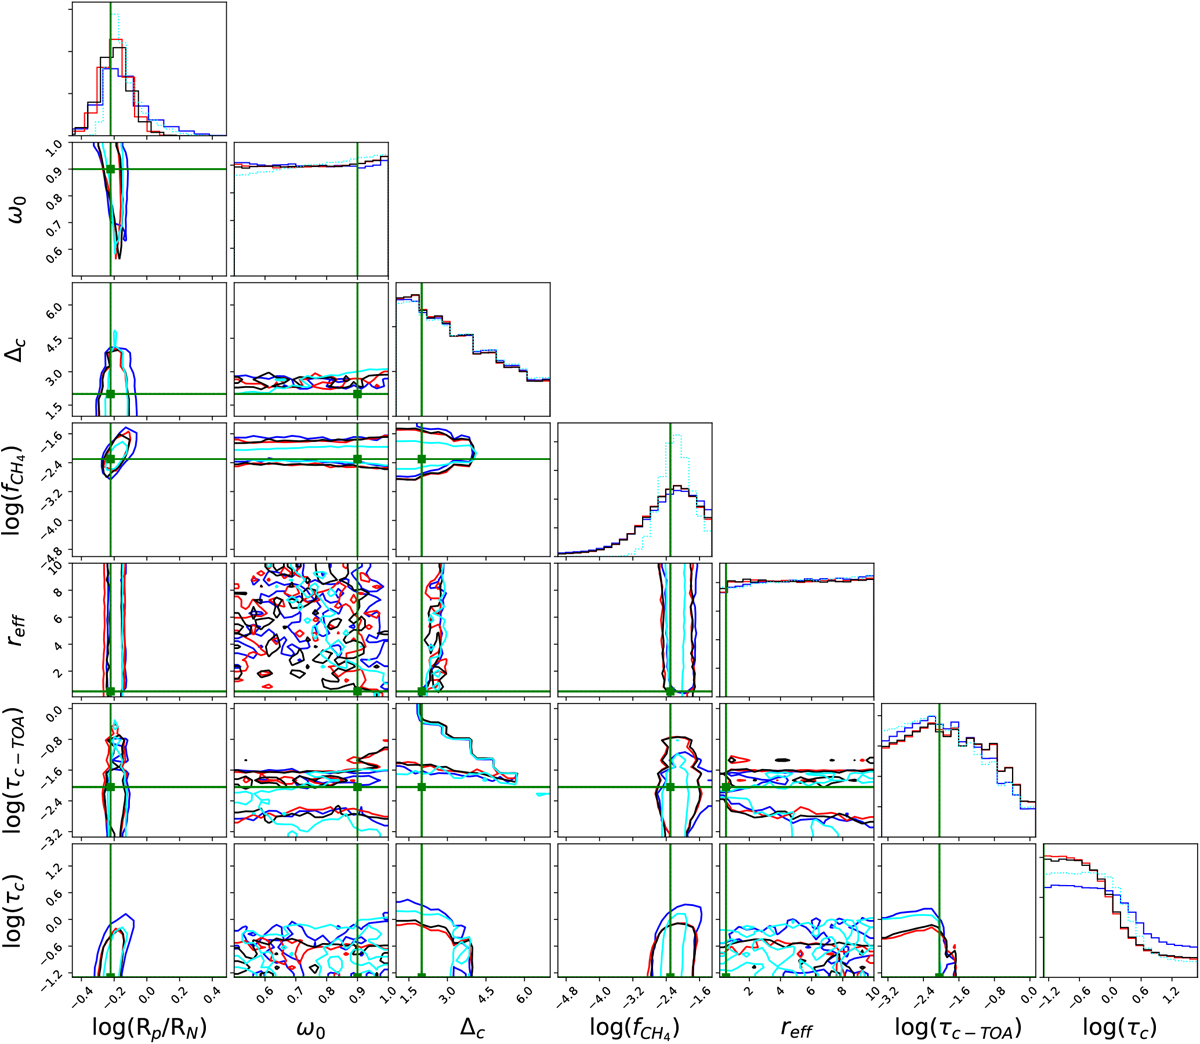
Fig. B.1
Download original image
Posterior probability distributions of the model parameters for several combinations of observations of the no-cloud atmospheric configuration, as described in Sect. 3.2. Blue lines indicate the combination (37°+85°), red lines, (37°+123°), and black lines, (37°+85°+123°). For reference, cyan lines indicate the results of a single-phase observation at α = 37° but doublingthe S∕N to 20). Green lines mark the true values of the model parameters (see Sect. 3.1) for this observation. Two-dimensional subplots show the correlations between pairs of parameters. Contour lines correspond to the 1 σ confidence levels.
Current usage metrics show cumulative count of Article Views (full-text article views including HTML views, PDF and ePub downloads, according to the available data) and Abstracts Views on Vision4Press platform.
Data correspond to usage on the plateform after 2015. The current usage metrics is available 48-96 hours after online publication and is updated daily on week days.
Initial download of the metrics may take a while.