Open Access
Fig. 12
Download original image
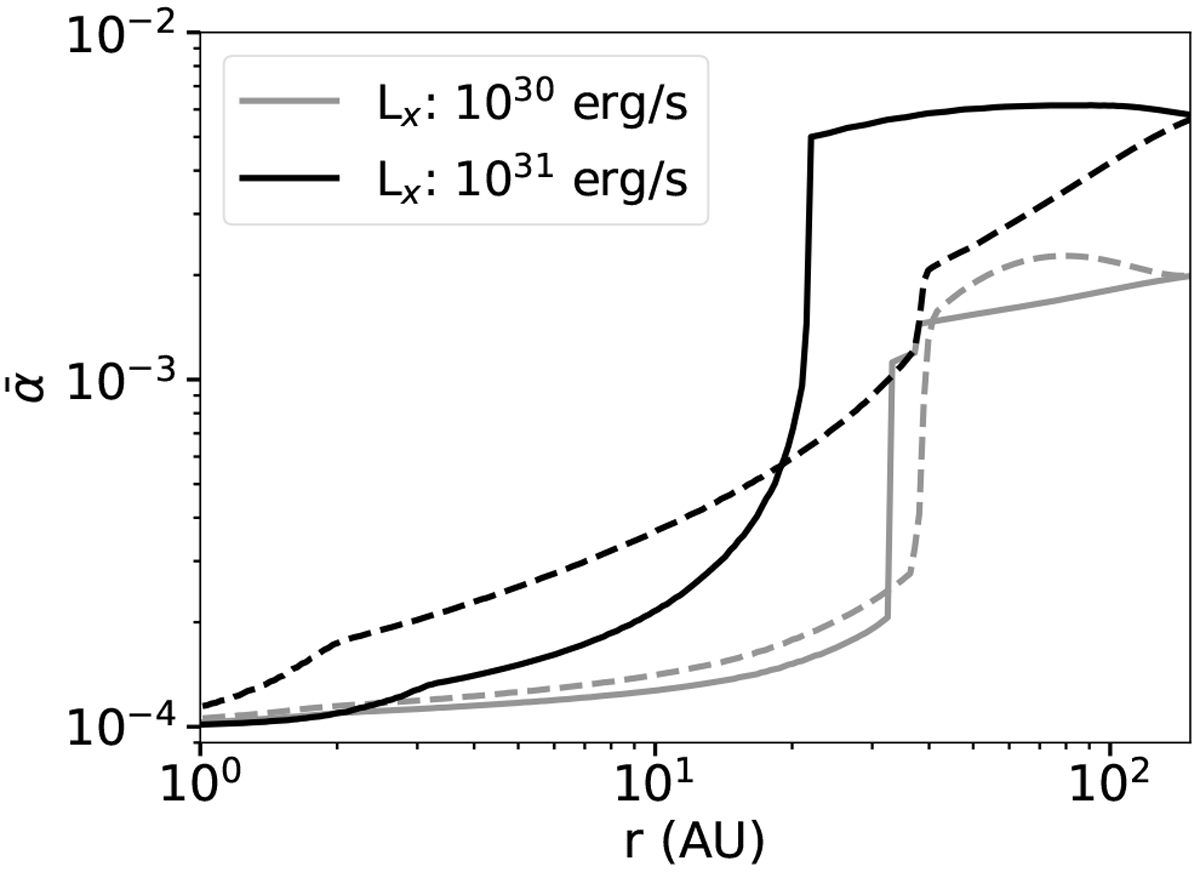
Effective turbulence ![]() profile for different X-ray luminosities, derived using the MRI model described in Delage et al. (in prep.). The solid and dashed lines correspond to the steady-state scenario and the Lynden-Bell & Pringle (1974) scenario, respectively. See Sect. 6.3.
profile for different X-ray luminosities, derived using the MRI model described in Delage et al. (in prep.). The solid and dashed lines correspond to the steady-state scenario and the Lynden-Bell & Pringle (1974) scenario, respectively. See Sect. 6.3.
Current usage metrics show cumulative count of Article Views (full-text article views including HTML views, PDF and ePub downloads, according to the available data) and Abstracts Views on Vision4Press platform.
Data correspond to usage on the plateform after 2015. The current usage metrics is available 48-96 hours after online publication and is updated daily on week days.
Initial download of the metrics may take a while.