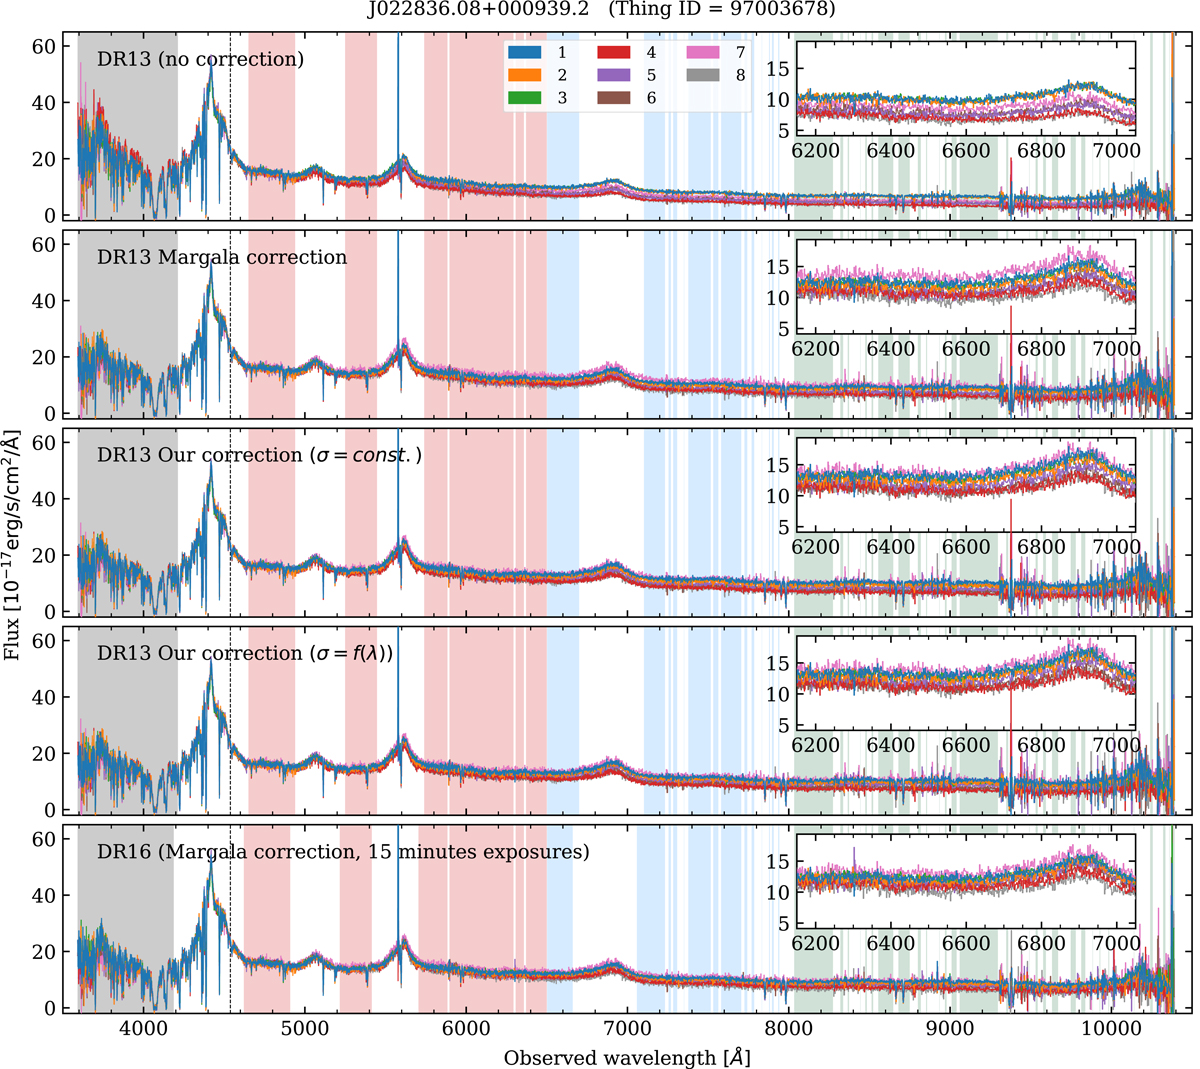
Fig. 6.
Download original image
Eight BOSS observations of the quasar J022836.08+000939.2 (Thing ID 97003678). Individual observations are shown as coloured lines, with the legend showing the observation ID in Table 2. The wording within each box shows which correction has been applied (no correction has been applied in the top box, DR13). The inset in each panel illustrates a shorter wavelength region in more detail, giving a clearer view of the scatter between multiple exposures. The shaded areas show the regions used to calculate ξ2 and its associated error, Eqs. (16) and (17), and results listed in Table 3. The different colours correspond to the four wavebands used. The vertical dashed line around 4538 Å shows the point at which spectra are normalised to a common flux. The spike at 5600 Å is due to a cosmic ray hit.
Current usage metrics show cumulative count of Article Views (full-text article views including HTML views, PDF and ePub downloads, according to the available data) and Abstracts Views on Vision4Press platform.
Data correspond to usage on the plateform after 2015. The current usage metrics is available 48-96 hours after online publication and is updated daily on week days.
Initial download of the metrics may take a while.