Fig. 1.
Download original image
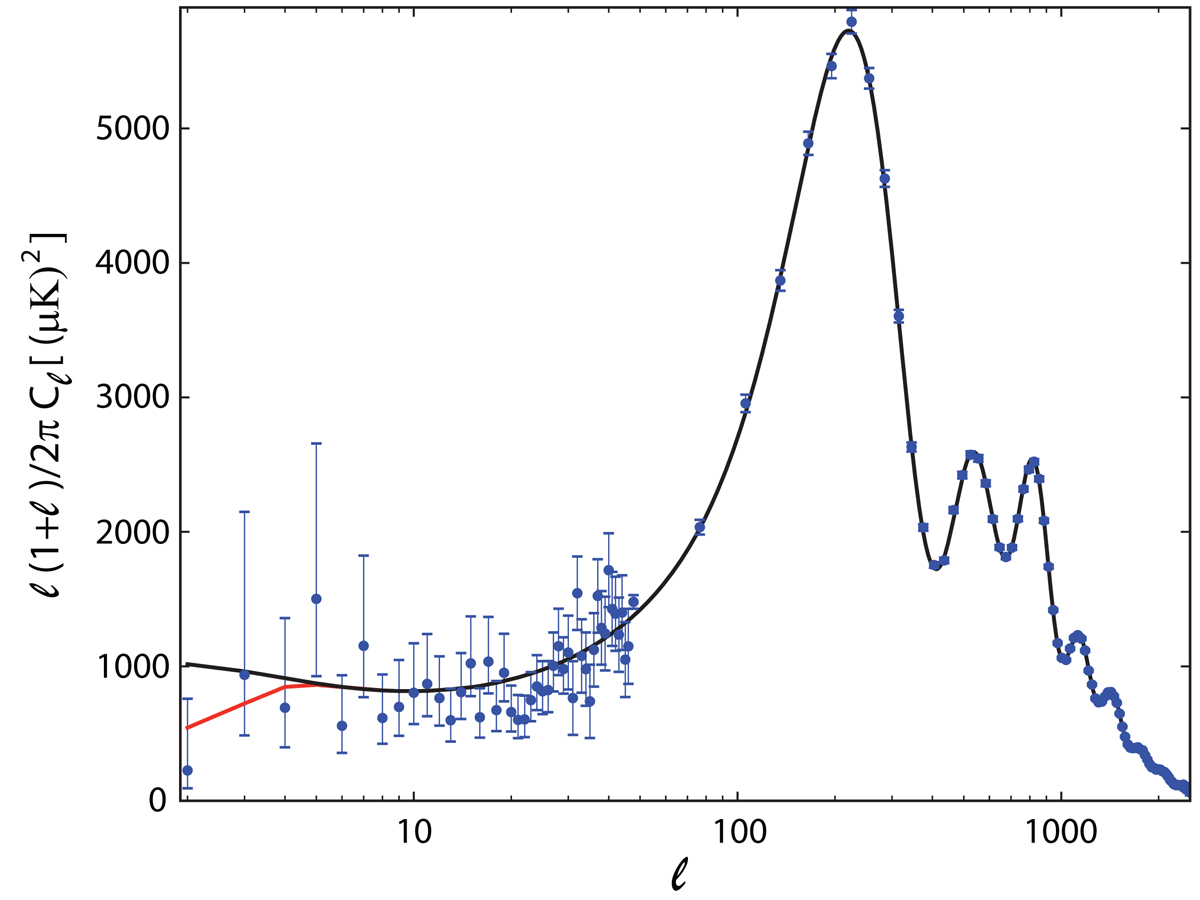
Angular power spectrum (blue dots) estimated with the NLIC method, with 1σ Fisher errors. These error bars include cosmic variance, approximated as Gaussian (see Fig. 1 in Planck Collaboration VI 2020). The ΛCDM best fit model (![]() ), with a power-law fluctuation distribution and kmin = 0, is shown in black. The red curve (for kmin = 2.82/rdec) is the best fit to the whole range of ℓ’s with an optimized kmin ≠ 0. The two curves are indistinguishable at ℓ ≳ 6, but deviate significantly from each other for the low multipole moments, corresponding to large angles (≳60°). The Sachs-Wolfe contribution to
), with a power-law fluctuation distribution and kmin = 0, is shown in black. The red curve (for kmin = 2.82/rdec) is the best fit to the whole range of ℓ’s with an optimized kmin ≠ 0. The two curves are indistinguishable at ℓ ≳ 6, but deviate significantly from each other for the low multipole moments, corresponding to large angles (≳60°). The Sachs-Wolfe contribution to ![]() dominates at ℓ ≲ 30, while local physical effects, such as acoustic oscillations, dominate at ℓ ≳ 30.
dominates at ℓ ≲ 30, while local physical effects, such as acoustic oscillations, dominate at ℓ ≳ 30.
Current usage metrics show cumulative count of Article Views (full-text article views including HTML views, PDF and ePub downloads, according to the available data) and Abstracts Views on Vision4Press platform.
Data correspond to usage on the plateform after 2015. The current usage metrics is available 48-96 hours after online publication and is updated daily on week days.
Initial download of the metrics may take a while.