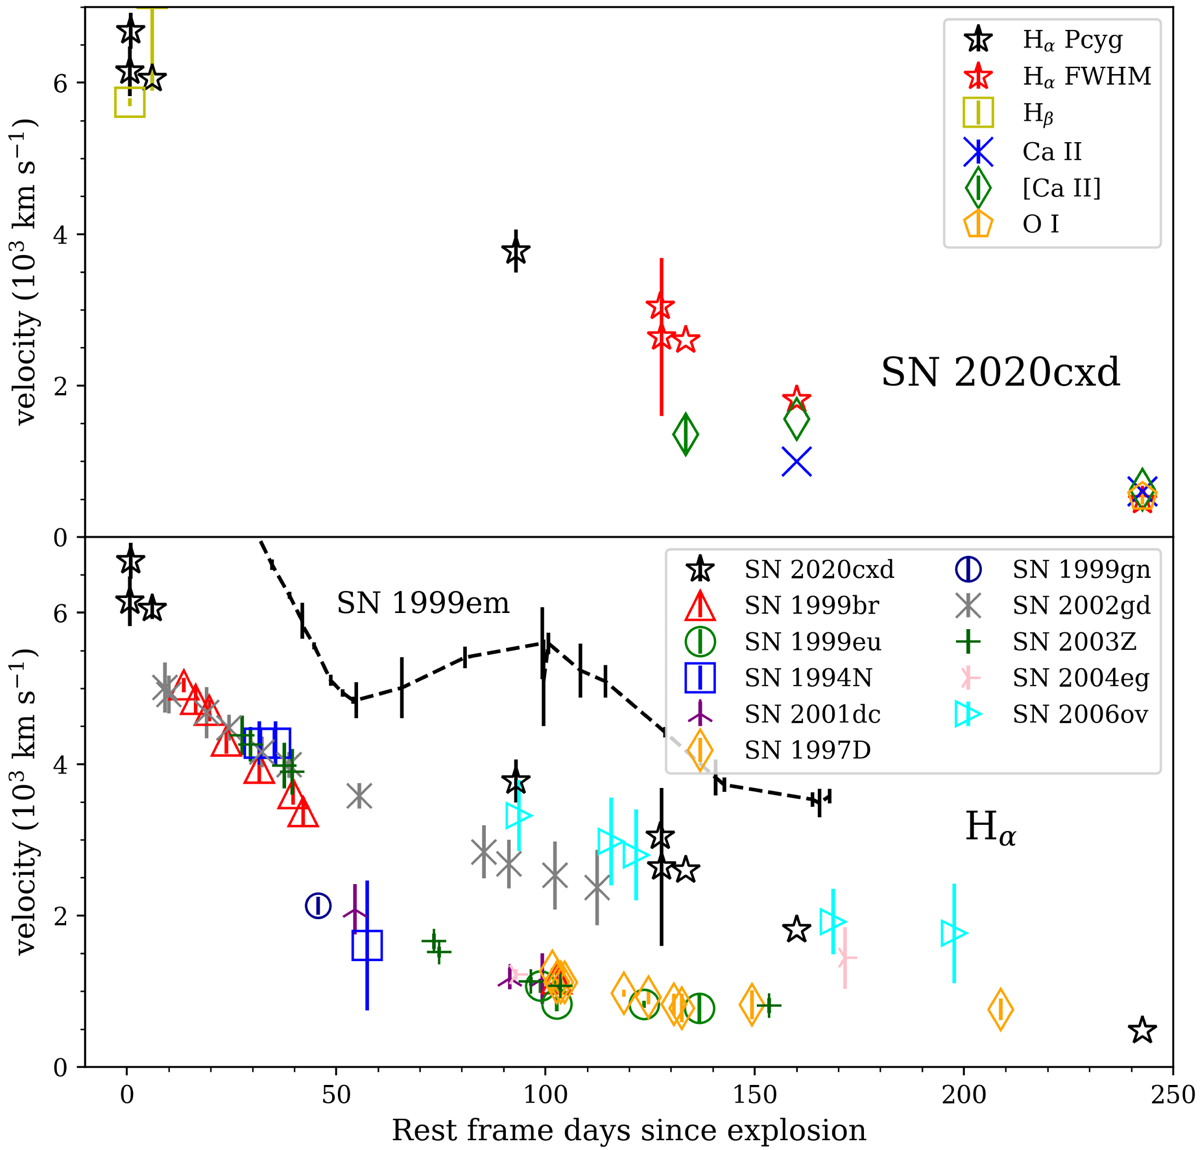
Fig. 9.
Download original image
Velocity evolution of SN 2020cxd. Upper panel shows the expansion velocities estimated from Hα P-Cygni minima (black stars) and FWHM (red stars), Hβ P-Cygni minima (yellow squares), [Ca II] λ7291 line FWHM (blue cross), FWHM of Ca II NIR triplet middle line (green diamonds), and [O I] λ6300 line FWHM (orange pentagons). Hα velocities for SN 2020cxd compared to other LL SNe discussed throughout the paper. A comparison with the normal Type II SN 1999em is shown in the lower panel. The x-axis shows the phase with respect to explosion. Line velocities of the other LL SNe II are taken from Pastorello et al. (2004) to Spiro et al. (2014).
Current usage metrics show cumulative count of Article Views (full-text article views including HTML views, PDF and ePub downloads, according to the available data) and Abstracts Views on Vision4Press platform.
Data correspond to usage on the plateform after 2015. The current usage metrics is available 48-96 hours after online publication and is updated daily on week days.
Initial download of the metrics may take a while.