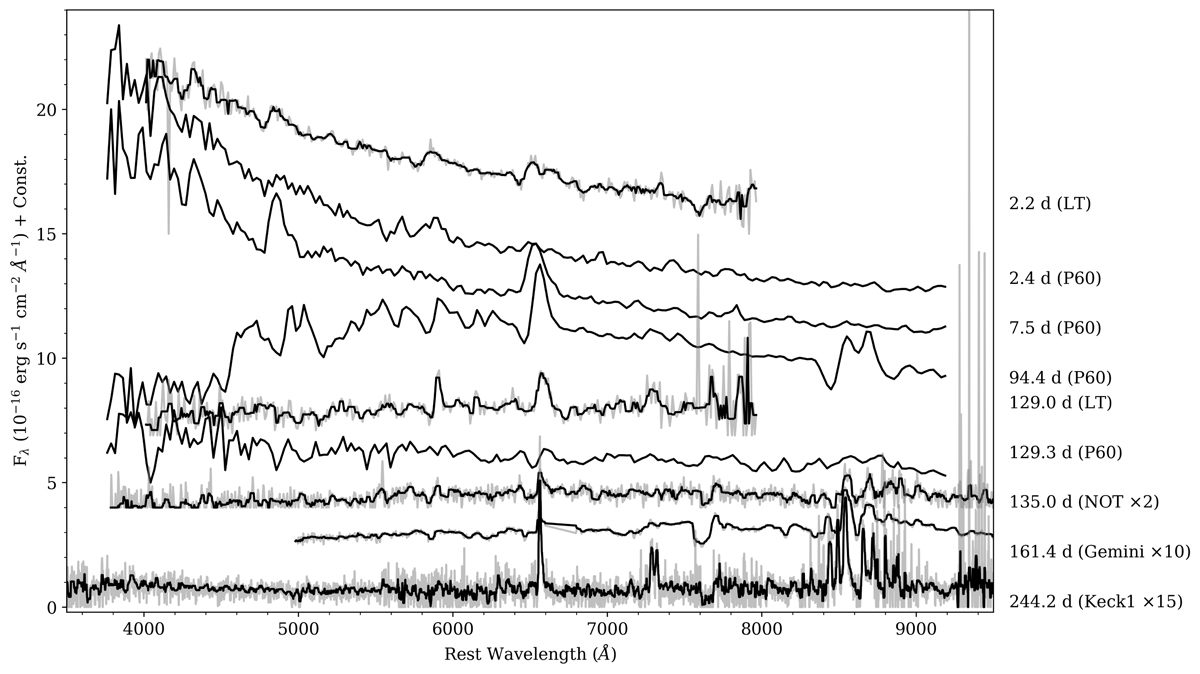
Fig. 4.
Download original image
Sequence of optical spectra for SN 2020cxd, corrected for redshift and reddening. The complete log of spectra is provided in Table 4. The epoch (rest frame days since explosion) of the spectra is provided to the right. The spectra are shifted in flux by a constant for clarity. Late time spectra are scaled for comparison. The scaling factors are also listed to the right. Some spectra are also binned (shown as black lines), with a window size of 5 Å for LT, and 10 Å for NOT/Gemini/Keck, and their original spectra are shown in shaded grey.
Current usage metrics show cumulative count of Article Views (full-text article views including HTML views, PDF and ePub downloads, according to the available data) and Abstracts Views on Vision4Press platform.
Data correspond to usage on the plateform after 2015. The current usage metrics is available 48-96 hours after online publication and is updated daily on week days.
Initial download of the metrics may take a while.