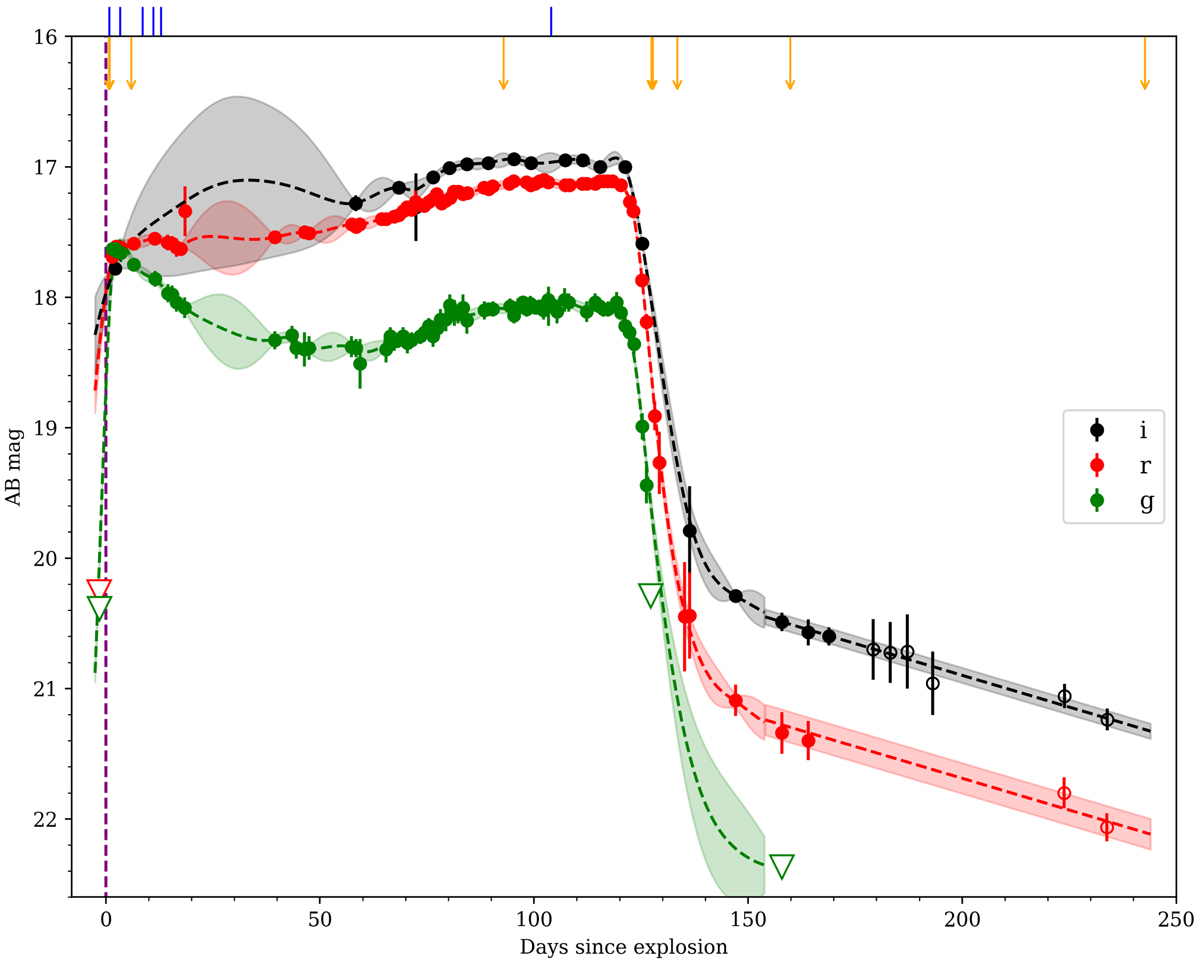
Fig. 2.
Download original image
Light curves of SN 2020cxd in the g (green symbols), r (red), and i (black) bands. These are host-subtracted magnitudes from the P48, P60, and LT, as well as two epochs from the NOT on the late tail. Forced photometry obtained using SNOoPY is plotted as open circles. All are observed (AB) magnitudes in the observer frame in days since the explosion. Relevant upper limits are displayed as inverted triangles, and constrain the explosion epoch of the SN (the purple vertical dashed line), as well as the g-band tail. The dashed lines with error regions are Gaussian process estimates of the interpolated and extrapolated LC. After 150 days, we show the linear fits instead. The yellow downward pointing arrows on top indicate the epochs of spectroscopy, the blue vertical bars display the epochs with Swift observations.
Current usage metrics show cumulative count of Article Views (full-text article views including HTML views, PDF and ePub downloads, according to the available data) and Abstracts Views on Vision4Press platform.
Data correspond to usage on the plateform after 2015. The current usage metrics is available 48-96 hours after online publication and is updated daily on week days.
Initial download of the metrics may take a while.