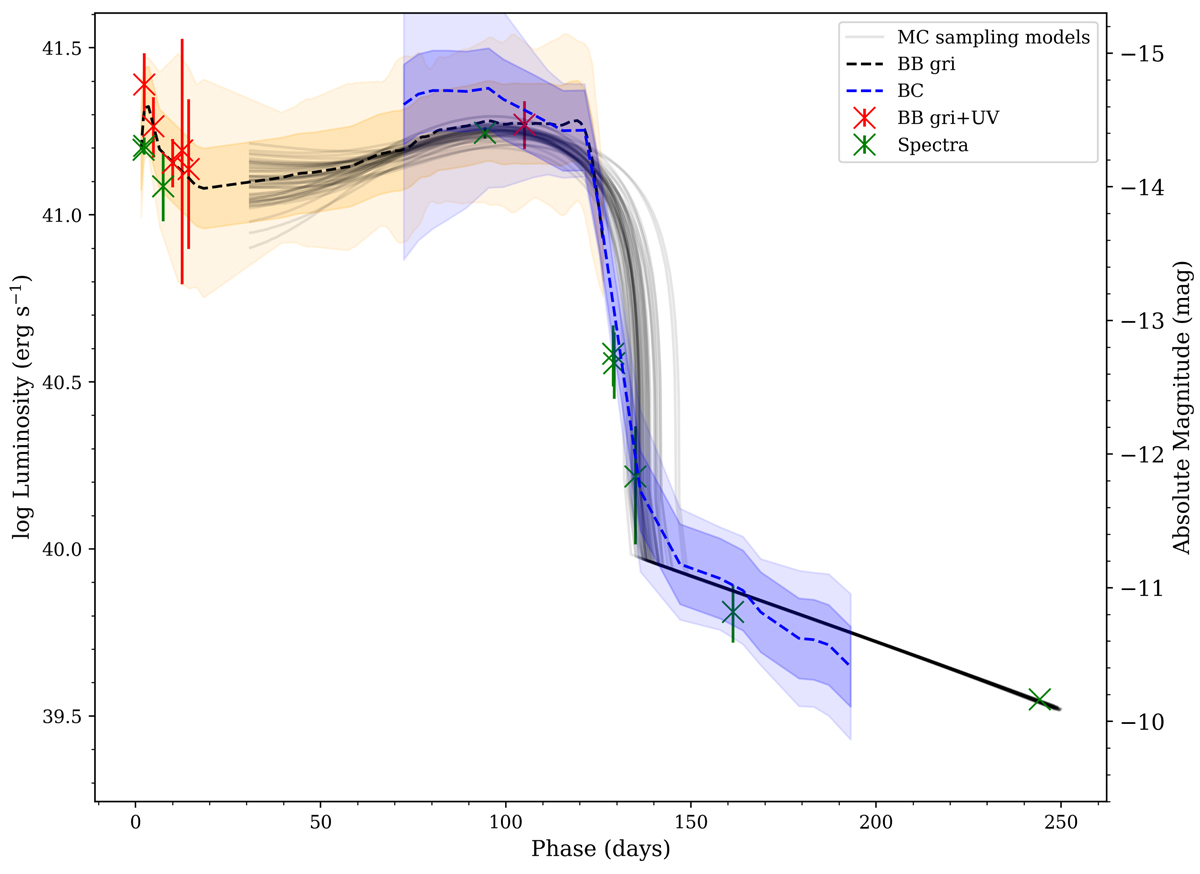
Fig. C.1.
Download original image
SN 2020cxd LC comparison between observations and sampled MCMC fits (solid black lines). The black dashed line represents the observed LC of SN 2020cxd at early phases from BB fitting, with the orange shaded region as errors from the distance uncertainty (dark) and from the fitted BB (light). The blue dashed line is the observed LC of SN 2020cxd at later epochs from the BC approach, with the blue shaded region as errors from the distance uncertainty (dark) and the fitted BB (light). The green crosses stands for the epochs with fluxes from direct spectral integration, while the red crosses is from BB fits with gri+UV photometry.
Current usage metrics show cumulative count of Article Views (full-text article views including HTML views, PDF and ePub downloads, according to the available data) and Abstracts Views on Vision4Press platform.
Data correspond to usage on the plateform after 2015. The current usage metrics is available 48-96 hours after online publication and is updated daily on week days.
Initial download of the metrics may take a while.