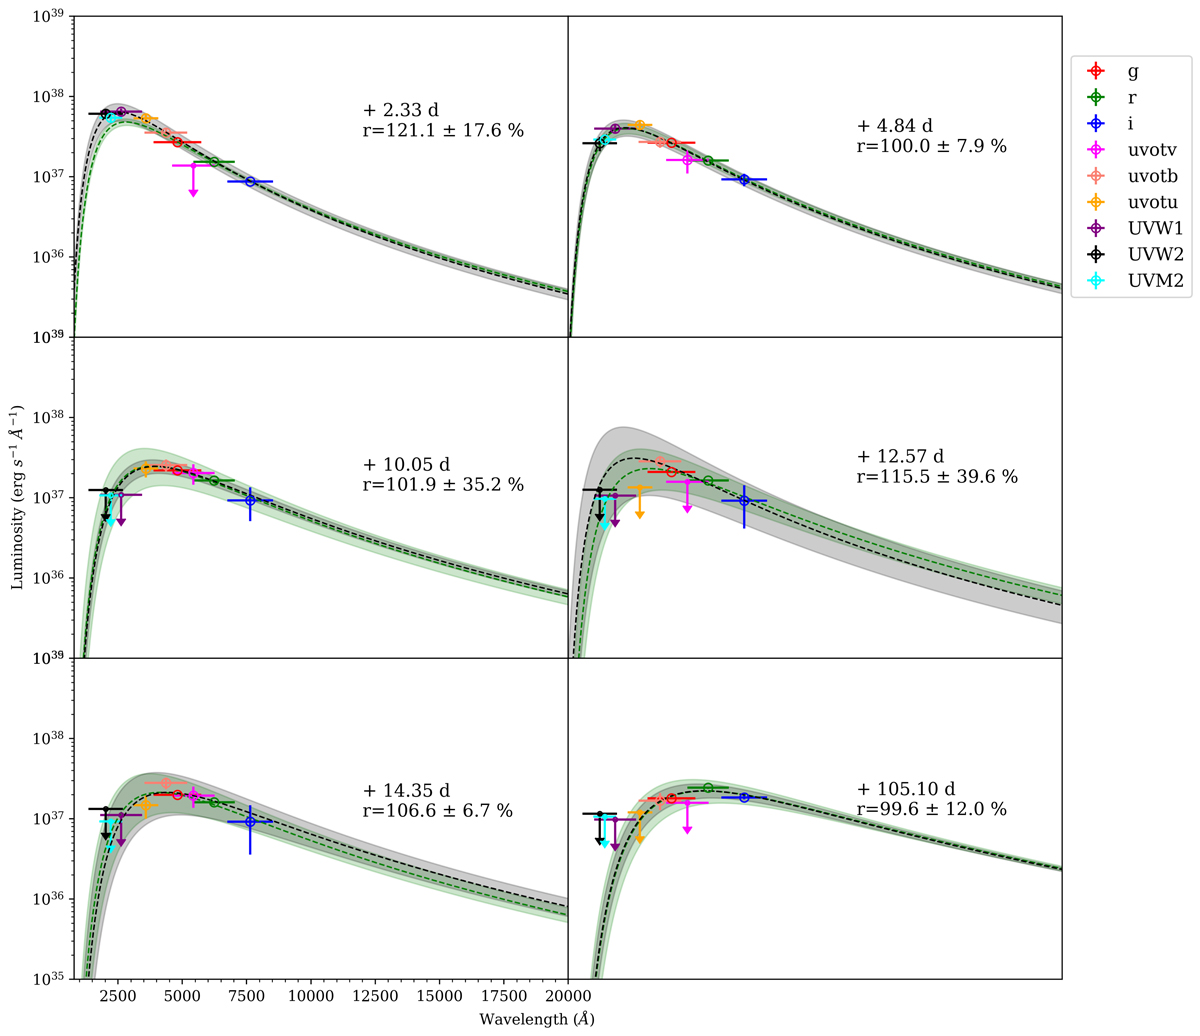
Fig. B.1.
Download original image
Blackbody fitting comparisons for SN 2020cxd. The six subplots compare the gri+UV constructed BB at the six epochs when Swift UVOT data are available to the gri inferred ones. Best fits of the full dataset are shown as the black dashed lines and the 3σ uncertainties are overplotted as the grey shaded regions. Best fits and errors of the gri dataset are instead shown as green dashed lines and shaded areas. The rest frame phase, as well as the ratio between the integrated luminosities of the full and gri datasets, are provided to the right in each subplot.
Current usage metrics show cumulative count of Article Views (full-text article views including HTML views, PDF and ePub downloads, according to the available data) and Abstracts Views on Vision4Press platform.
Data correspond to usage on the plateform after 2015. The current usage metrics is available 48-96 hours after online publication and is updated daily on week days.
Initial download of the metrics may take a while.