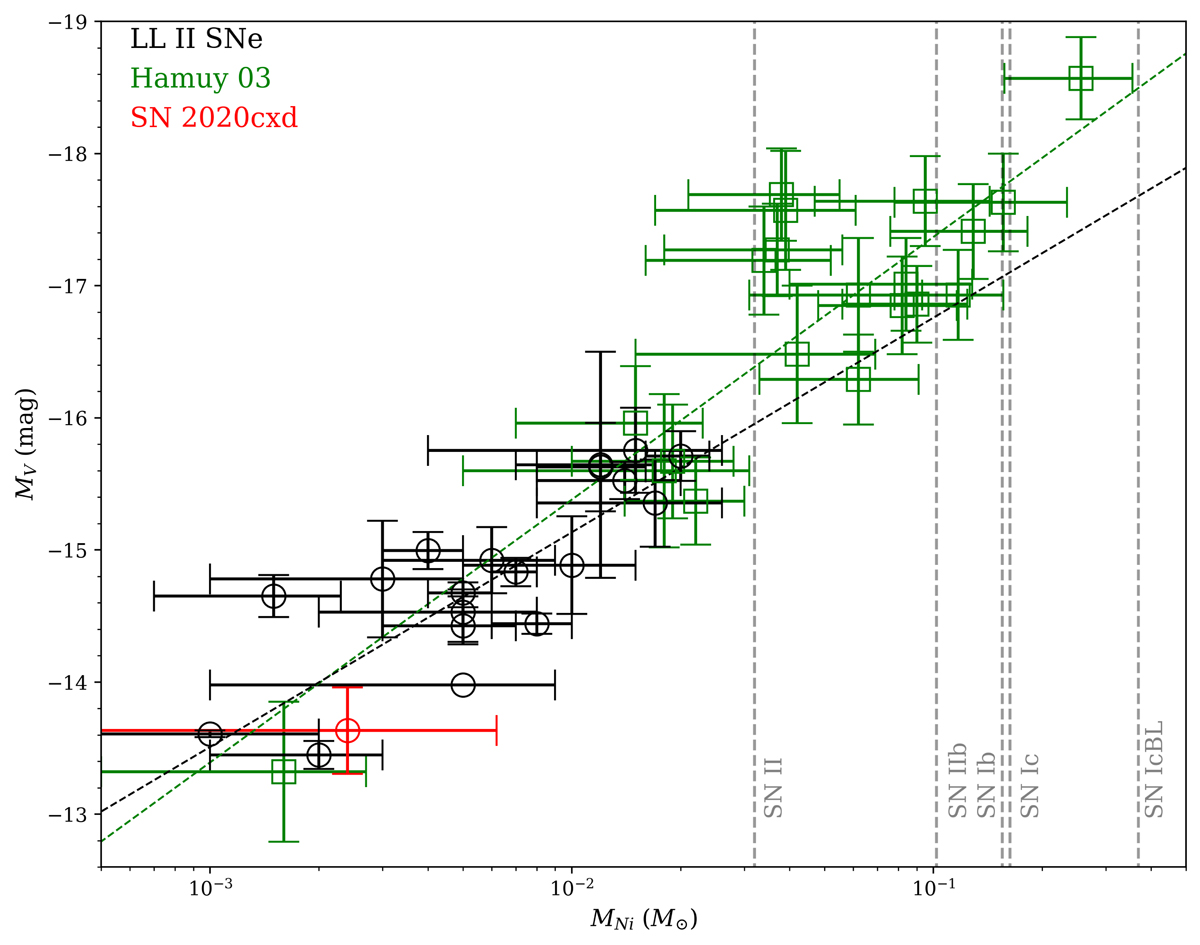
Fig. 13.
Download original image
Absolute V-band plateau magnitudes (computed at day 50) versus ejected nickel mass. Black circles represent the LL SN IIP sample (from Table 1), green squares are the SNe IIP from Hamuy (2003). SN 2020cxd is shown as a red data point. The grey dashed vertical lines represent the average nickel mass for different types of CC SNe from Anderson (2019). We perform linear fits on MV and log MNi for the Hamuy 2003 sample and for the LL SN IIP sample. The best fits are shown as the green and black dashed lines and give consistent relations.
Current usage metrics show cumulative count of Article Views (full-text article views including HTML views, PDF and ePub downloads, according to the available data) and Abstracts Views on Vision4Press platform.
Data correspond to usage on the plateform after 2015. The current usage metrics is available 48-96 hours after online publication and is updated daily on week days.
Initial download of the metrics may take a while.