Fig. 10.
Download original image
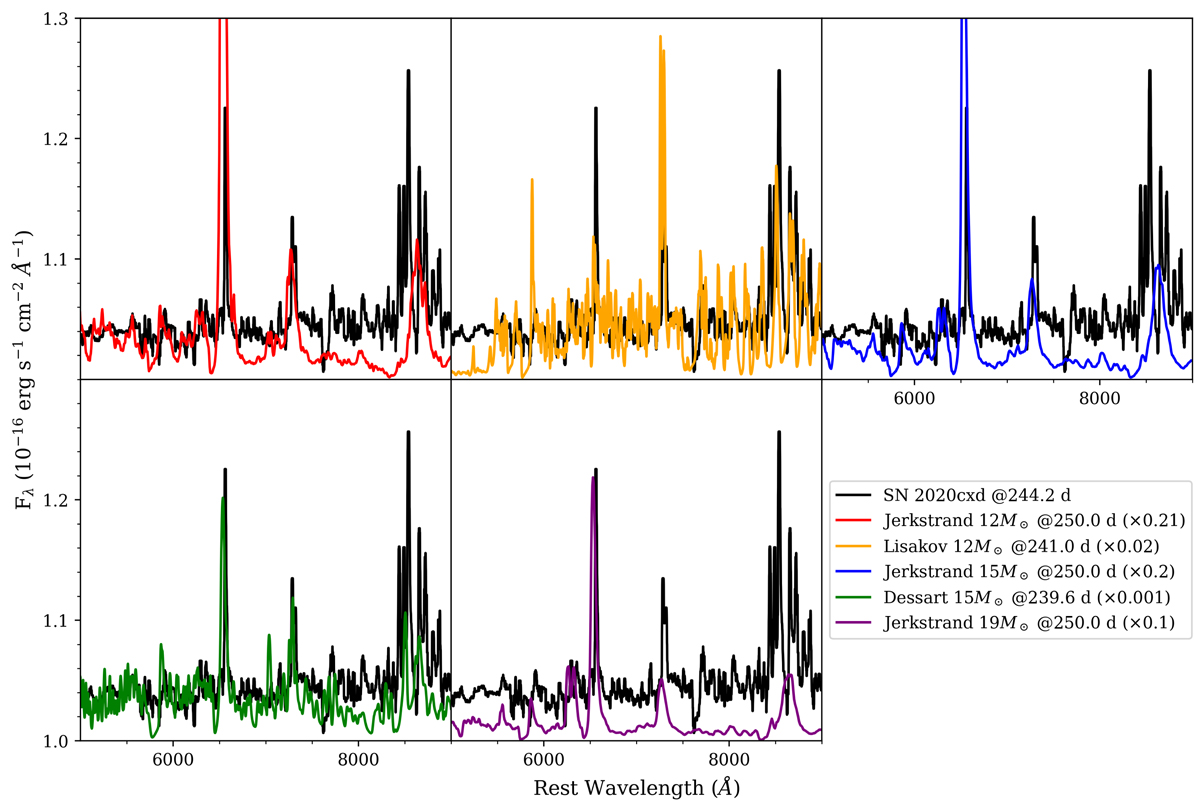
Comparison between the last Keck spectrum of SN 2020cxd at nebular phases and scaled synthetic spectra. The black curves are the observed spectra, binned with a window size of 10 Å, and corrected for redshift and extinction. The models are displayed with coloured lines, and originate from Jerkstrand et al. (2012, 2014), Dessart et al. (2013), Lisakov et al. (2016). These were obtained via WISeREP. The models are scaled by nickel mass ratio. All model spectra are shifted to the SN distance by the inverse square of the distance. Their rest frame phases and scaling factors are shown in the legend.
Current usage metrics show cumulative count of Article Views (full-text article views including HTML views, PDF and ePub downloads, according to the available data) and Abstracts Views on Vision4Press platform.
Data correspond to usage on the plateform after 2015. The current usage metrics is available 48-96 hours after online publication and is updated daily on week days.
Initial download of the metrics may take a while.