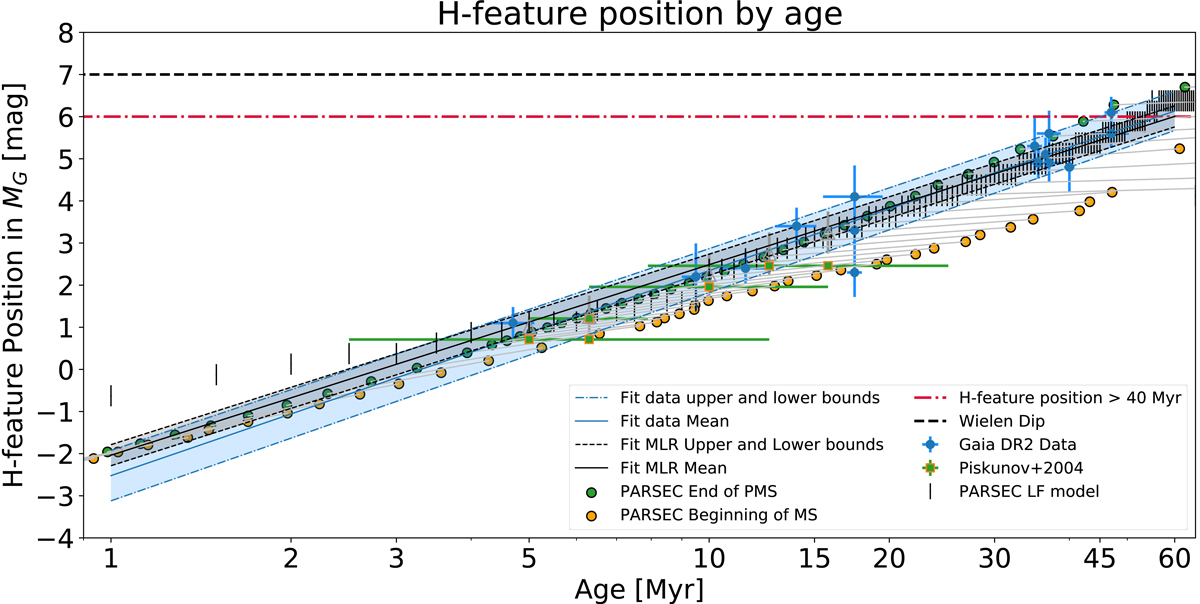
Fig. 7.
Download original image
Fitted empirical age–H-peak relations. The data points are the same as in Fig. 6. The blue solid line represents the peak-age function fitted from the observed data (blue points). The area shaded in blue is the uncertainty range, and the lower and upper bounds of the uncertainty are indicated by the thin blue dot-dashed lines. The black line is the peak-age function fitted from the PARSEC model points (black bars). The area shaded in gray is the uncertainty range and the lower and upper bounds are given by the thin black dashed lines.
Current usage metrics show cumulative count of Article Views (full-text article views including HTML views, PDF and ePub downloads, according to the available data) and Abstracts Views on Vision4Press platform.
Data correspond to usage on the plateform after 2015. The current usage metrics is available 48-96 hours after online publication and is updated daily on week days.
Initial download of the metrics may take a while.