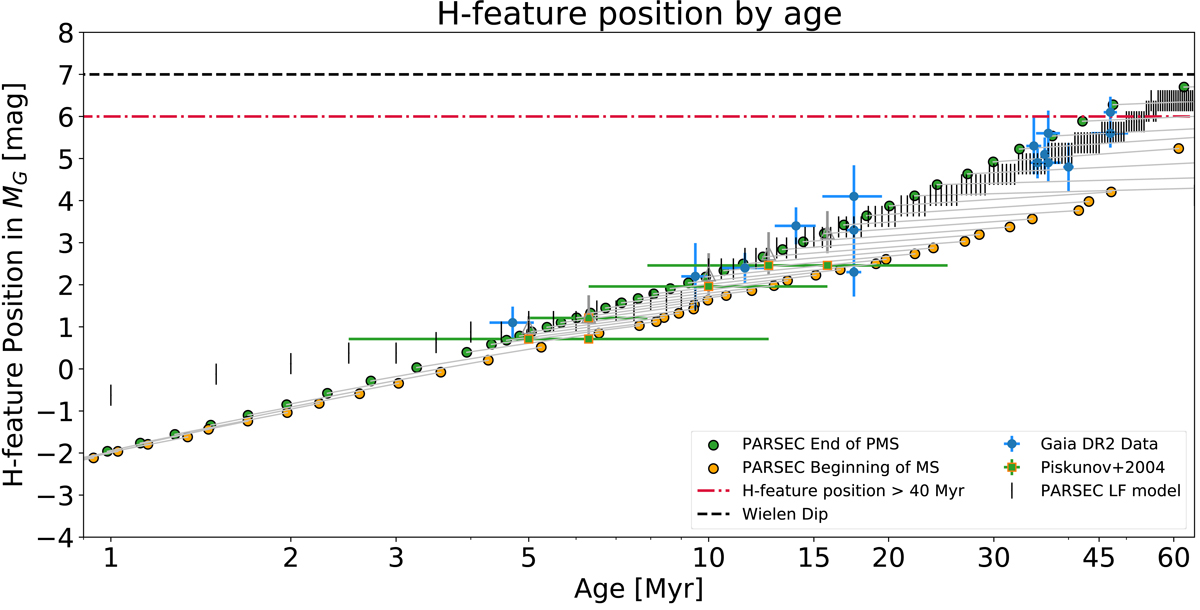
Fig. 6.
Download original image
Relation between the age and the location of the H-peak is extracted from four sources. The location of the observed H-peak (blue points) were measured as a local maximum in Figs. 3 and 4. The error bars indicate the uncertainty range of the peak using the size of the kernel bandwidth as half of the error bar length, and the center dot indicates the position of the peak. The green squares are from Piskunov et al. (2004). The black bars represent the range in magnitudes where the H-peak in the LF curve occurs as a local maximum, and the range of the bar is twice the bin size (0.25 mag). The green and yellow dots are critical points from the PARSEC evolutionary tracks, the relative location of the dots on the Hertzsprung–Russell diagram can be found in Fig. C.1.
Current usage metrics show cumulative count of Article Views (full-text article views including HTML views, PDF and ePub downloads, according to the available data) and Abstracts Views on Vision4Press platform.
Data correspond to usage on the plateform after 2015. The current usage metrics is available 48-96 hours after online publication and is updated daily on week days.
Initial download of the metrics may take a while.