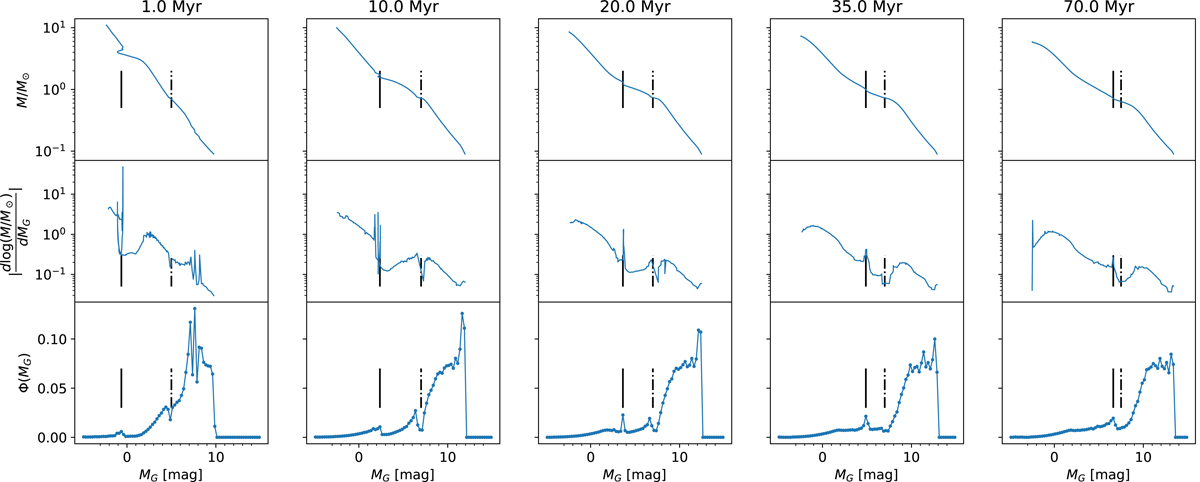
Fig. 5.
Download original image
MLR, derivative of MLR, and LF from the PARSEC models in five snapshots. Top panels: MLR from the PARSEC model, as mass vs. MG. Middle panels: absolute value of the derivative | d log m/dMG |. Bottom panels: luminosity functions from the PARSEC model. Each column is taken from a snapshot at a different time (indicated at the top) of the simulated population. In each panel the position of the H-peak is indicated by a vertical solid line, and the location of the Wielen dip by a vertical dot-dashed line.
Current usage metrics show cumulative count of Article Views (full-text article views including HTML views, PDF and ePub downloads, according to the available data) and Abstracts Views on Vision4Press platform.
Data correspond to usage on the plateform after 2015. The current usage metrics is available 48-96 hours after online publication and is updated daily on week days.
Initial download of the metrics may take a while.