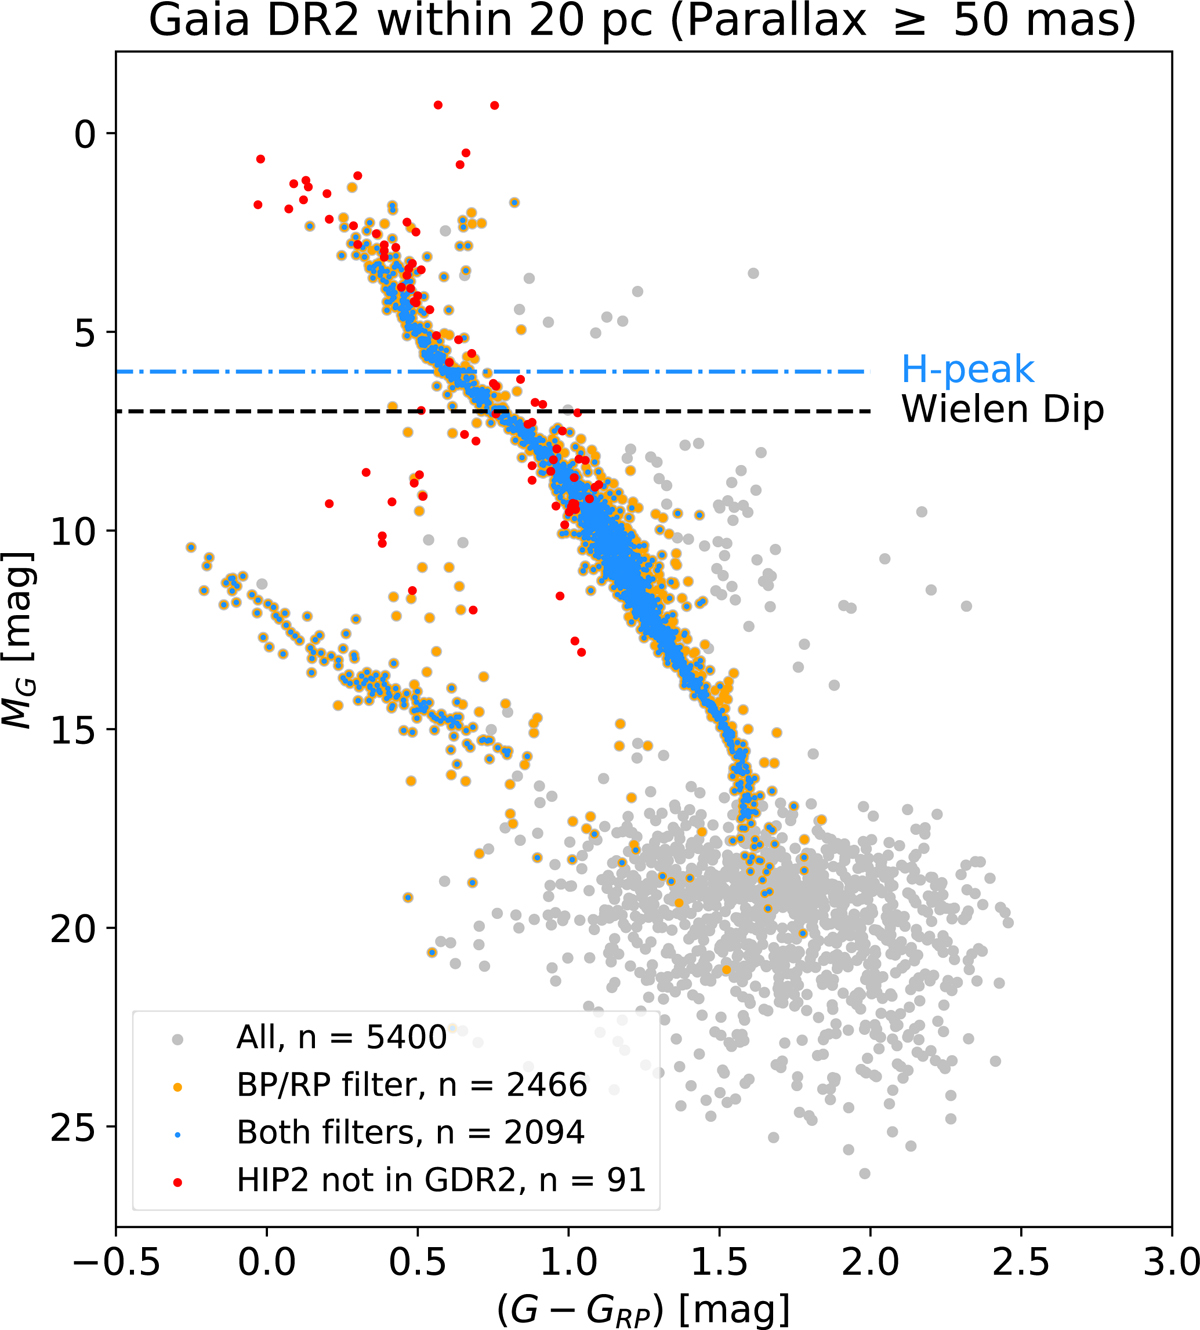
Fig. 2.
Download original image
Gaia DR2 objects within 20 pc plotted in the color–absolute magnitude diagram. The gray points are all objects within 20 pc; the orange points are all objects that pass the BP/RP filter; the blue points are objects that pass both the BP/RP excess filter and the RUWE < 1.4 filter (the sample used to make the blue curve in Fig. 1). The gray points form a clump below MG ≃ 15 mag. These have unreliable astrometry and photometry. On the blue side of the main sequence the white dwarf cooling sequence is apparent.
Current usage metrics show cumulative count of Article Views (full-text article views including HTML views, PDF and ePub downloads, according to the available data) and Abstracts Views on Vision4Press platform.
Data correspond to usage on the plateform after 2015. The current usage metrics is available 48-96 hours after online publication and is updated daily on week days.
Initial download of the metrics may take a while.