Fig. C.3.
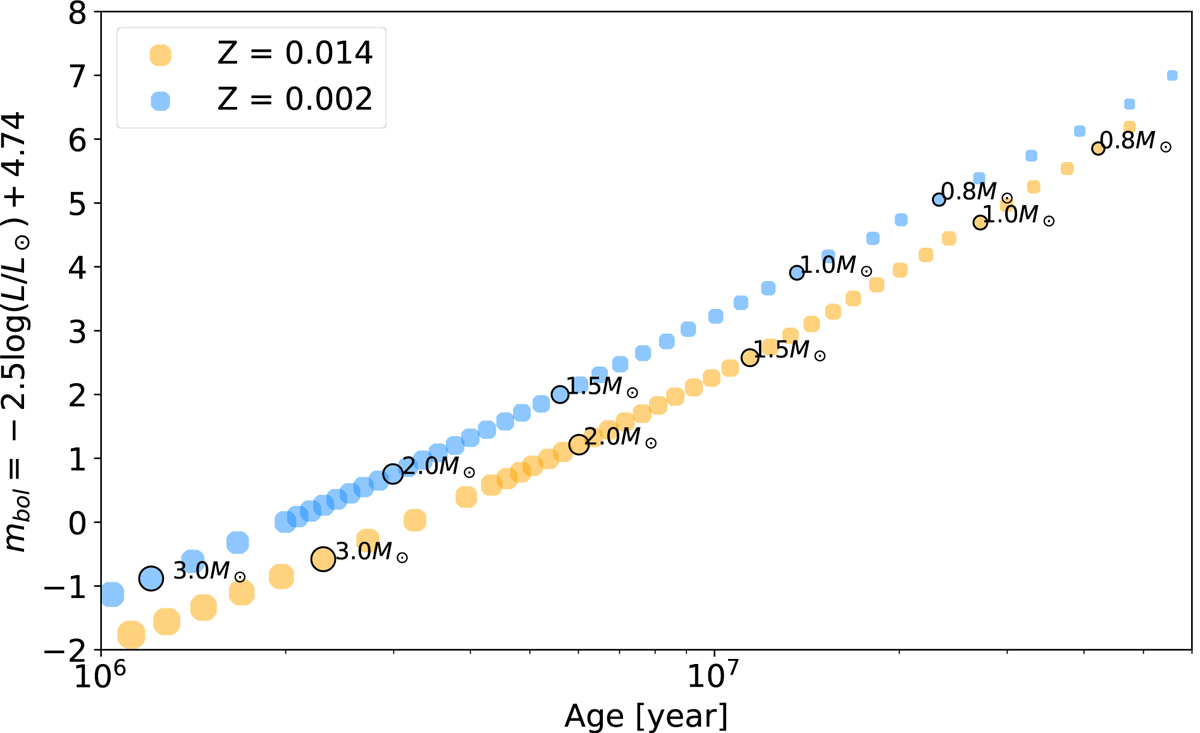
Download original image
End PMS evolutionary critical points in bolometric magnitude as a function of age, in Z = 0.002 (blue) and Z = 0.014 (orange). The size of the symbols is proportional to the corresponding initial mass of the model. The mass of some of the points is explicitly indicated in the plot with a black circle. This plot shows that at a given moment, in the lower metallicity population, the stars at the end of the PMS phase have a lower initial mass, and therefore a lower luminosity. This creates the shift we observe in the H-peak positions predicted by the lower metallicity models.
Current usage metrics show cumulative count of Article Views (full-text article views including HTML views, PDF and ePub downloads, according to the available data) and Abstracts Views on Vision4Press platform.
Data correspond to usage on the plateform after 2015. The current usage metrics is available 48-96 hours after online publication and is updated daily on week days.
Initial download of the metrics may take a while.