Fig. 9
Download original image
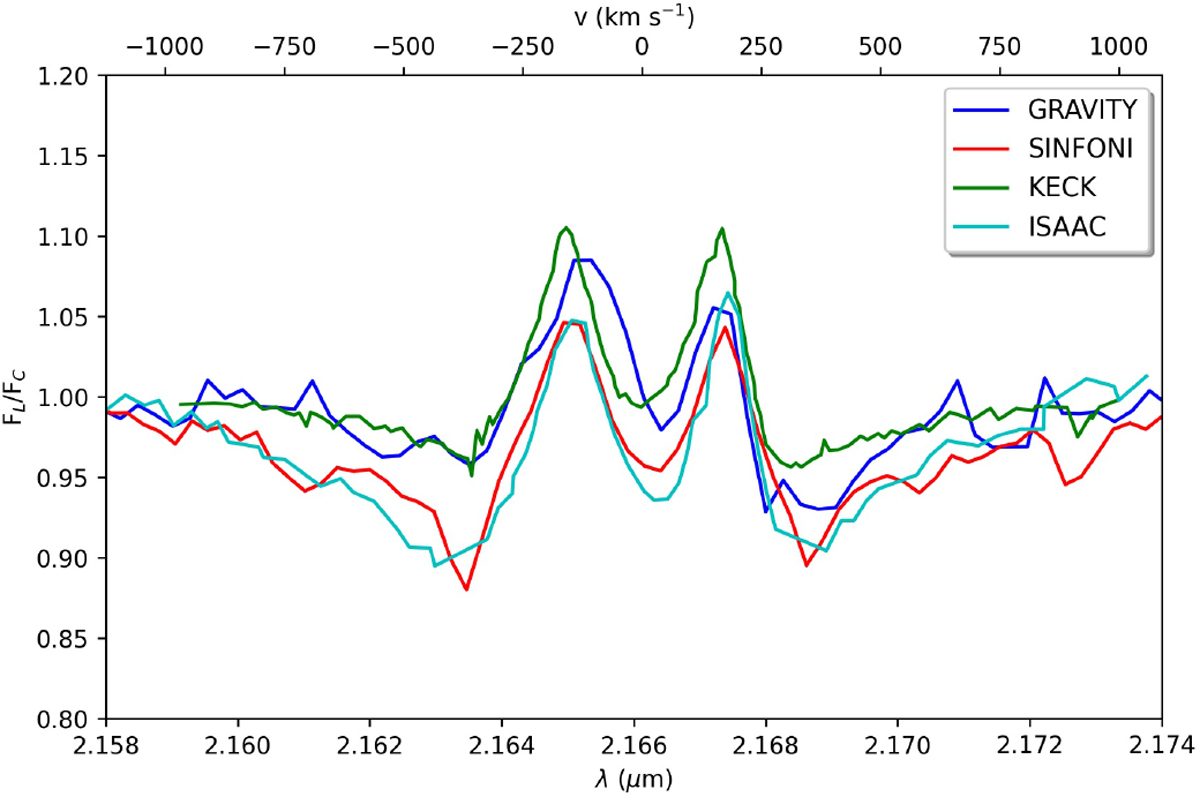
HD 141569 continuum-normalized spectrum taken at different epochs and with different instruments. In blue is depicted thedata taken on July 12, 2019, by GRAVITY; in red data taken in June 2019 by SINFONI; in green data taken in 2002 by the KECK NIRSPEC (Brittain et al. 2007); and in cyan data taken in 2004 by the VLT/ISAAC (Garcia Lopez et al. 2006).
Current usage metrics show cumulative count of Article Views (full-text article views including HTML views, PDF and ePub downloads, according to the available data) and Abstracts Views on Vision4Press platform.
Data correspond to usage on the plateform after 2015. The current usage metrics is available 48-96 hours after online publication and is updated daily on week days.
Initial download of the metrics may take a while.